
Hurricanes are associated in most people’s minds with powerful winds and the catastrophic wind damage they can inflict, but precipitation-induced flood losses can also be substantial. Hurricanes Harvey and Florence in 2017 and 2018, respectively, and Hurricane Ida in 2021 underscore the risk.
The heavy precipitation that accompanies a hurricane system often results in major flooding; this can impact regions far from the landfall and long after the winds have subsided. Recognizing this significant flood risk and that climate change is likely increasing precipitation extremes, AIR leveraged our experience in simulating precipitation associated with tropical cyclones to update our U.S. hurricane model in 2020 to include a hurricane precipitation-induced flood risk component. While this new component reflected the more obvious hurricane precipitation-induced flood risk for the coastal Gulf states, it also highlighted hurricane-induced flood risk in the Mid-Atlantic and Northeastern states; the severe flooding in New York, New Jersey, and Pennsylvania due to heavy rainfall associated with Ida showed that the latter, less obvious risk is very real.
Ida was downgraded to an extratropical low as it moved over the Appalachians and into the Northeast, where it combined with a frontal zone and produced prodigious rainfall. The Central Park weather station recorded 3.15 inches of rainfall in 1 hour, breaking the record set only a few days prior by Tropical Storm Henri. In just a few hours, up to 9 inches fell across the region.
Ida’s precipitation fell on districts still saturated following the recent passage of what was left of hurricanes Fred and Henri and on urban areas in Pennsylvania, New Jersey, and New York equally ill-prepared to receive it. In New York City, for example, where more than the average rainfall for the month of September fell in one day, at least 18 lives were lost and much of the subway system was shut down. Flooding was reported from Pennsylvania to Massachusetts, with New York, New Jersey, and Pennsylvania bearing the brunt of the impact.
State-of-the-Science Simulation of Hurricane Precipitation
AIR’s updated and harmonized U.S. hurricane and inland flood models together provide a comprehensive and unified view of precipitation hazard and flood risk from all sources—hurricane and non-hurricane precipitation on and off the floodplains and coastal storm surge—across the contiguous U.S. The two models now employ the same, component-level vulnerability framework to quantify losses from both inland flooding and hurricane precipitation events; the same primary and secondary risk features are available and applied for both models.
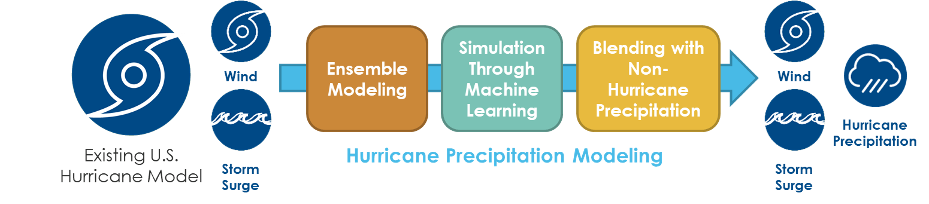
Based on their experience modeling typhoon precipitation for the Japan inland flood model, AIR researchers developed a novel hybrid technique combining high-resolution physically based modeling and machine learning algorithms to simulate precipitation fields along each of the more than 200,000 hurricane tracks in the AIR U.S. Hurricane model (Figure 2). To add hurricane-induced flooding to the model, each of the 200,000 tracks required unique and realistic spatio-temporal precipitation patterns be mapped to them.
Highlighting Hurricane Precipitation Flood Risk Representing the Near-Present Climate
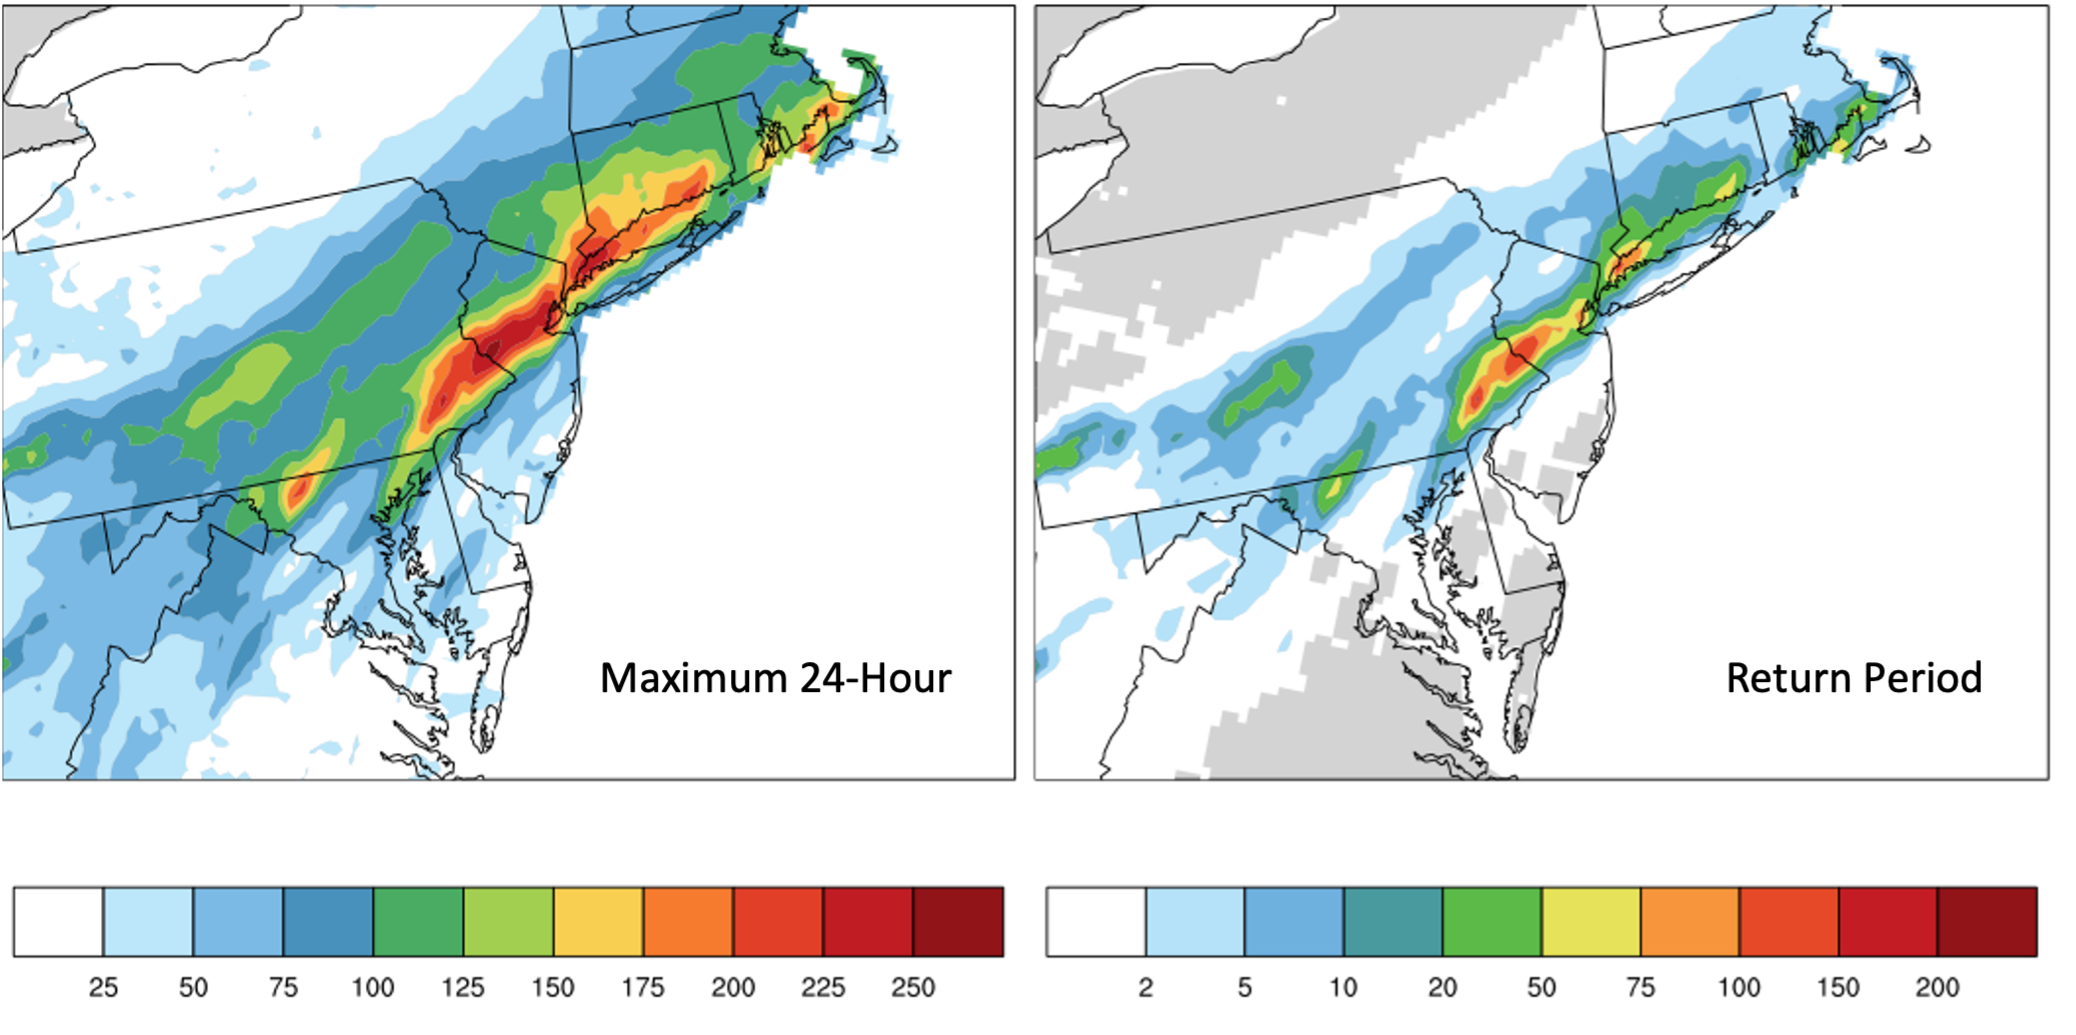
The AIR Hurricane Model for the United States provides a comprehensive view of hurricane precipitation flood risk, including insights into and capturing the significant flood risk in the Mid-Atlantic and Northeastern states. Figure 3 shows spatial extent 100-year return period quantiles of event-level hurricane precipitation within the 30-state model domain of the model. While the Gulf states, particularly their coastal areas, experience significant rainfall on a relatively regular basis, the Mid-Atlantic and Northeastern states receive high rainfall but at a lesser frequency and are therefore less prepared to handle flooding impacts. With Ida, for example, more rainfall fell over parts of Louisiana than in areas of Pennsylvania, New York, and New Jersey that saw historic levels of flooding impacts.
Climate change is expected to have significant impacts on hurricane activity in the United States, primarily through an increase in sea surface temperatures. It is likely to affect hurricanes in multiple ways, such as an increase in the frequency of the strongest storms, additional storm surge flooding due to sea level rise, and because as the atmosphere warms it can hold more moisture—amplifying historical precipitation patterns. Climate change has already had an impact on extreme precipitation and the AIR model provides a view of the near-present climate, which is therefore different from a historical perspective.
To account for recent extreme events such as Hurricane Harvey, and to represent the near-present climate, AIR has applied suitable adjustments to the Depth-Duration-Frequency (DDF) estimates to reflect recent observations without explicitly resorting to non-stationary statistical models. After performing extensive validation in a wide range of metrics on scales from seasonality, to extrema, to historical event comparisons—all of which compare favorably to the observed record over the past 30 years, including more recent events—we concluded that AIR’s precipitation catalog represents the recent climate and particularly the possible extrema (i.e., the 100-1,000+ year return period values). AIR’s precipitation catalog contains both Harvey- and Florence-like hurricane precipitation events, while also capturing other important hydrometeorological metrics, such as the climatology of heavy rainfall days across the continental U.S.
Key Takeaways in Changes in Risk
Some of the most densely populated areas in the U.S. are along the coasts of the Northeastern and Mid-Atlantic states, with heavy industrial development along many of the region's major rivers. Residential and commercial establishments alike in this part of the country have widespread prevalence of basements, which exacerbates flood damage. Some of these basements function as underground parking spaces further elevating the risk posed to automobiles from flooding. Underground infrastructure assets, including public transit stations and tunnels, are also vulnerable to flood damage. Damage patterns observed from Ida across various lines are similar to patterns observed in the aftermath of flooding from Hurricane Sandy in 2012, which impacted coastal New York and New Jersey. AIR research shows that increased hurricane event frequency and sea level rise will have a meaningful impact on future damage.
Our research indicates that the growth in the number of stronger storms, and landfalling storms overall, increases modeled losses by approximately 20%, with—as was expected—slightly larger changes in areas such as the Gulf and Southeast coasts where major landfalls are already more likely today. A new insight, however, is that the loss increases extend to hurricane-induced precipitation flooding in inland areas as well as to stronger storms that may penetrate farther from the coast.
Our model indicates, for example, elevated levels of risk in New York, New Jersey, and Pennsylvania, the very states in the Mid-Atlantic and Northeast that were hit hardest by Hurricane Ida. Our new view of hurricane risk, resulting from the introduction of the hurricane precipitation-induced flooding sub-peril to our model, increased by 15%, 18%, and 80% for New York, New Jersey, and Pennsylvania, respectively. The precipitation footprint and the return period map in Figure 1 corroborate the relatively higher flooding impacts and losses in these areas.
Considering the frequency and severity of precipitation-induced floods and the losses they can cause, managing just part of your flood risk is not optimal. High-resolution, physically based catastrophe models that simulate both hurricane and non-hurricane precipitation realistically can allow insurers to expand into new markets profitably and cover the flood insurance gap. Through the innovative methodologies and machine learning used in their development, AIR’s hurricane and inland flood models for the U.S. together offer the industry a unified and comprehensive view of flood risk from all precipitation events never before available to enhance your risk management and resilience strategies and help you truly own your U.S. flood risk from all sources.
Realistically capture inland flood risk; discover our hurricane model for U.S.