
We’re rapidly approaching the peak of hurricane season and according to a recent update from the National Oceanic and Atmospheric Administration (NOAA), the Atlantic hurricane season shows no signs of slowing. Just days after this update, three tropical storms formed in the Atlantic basin in the past week alone, with two making landfall. On August 16 Tropical Storm Fred made landfall in the Florida Panhandle with peak winds of 65 mph. Hurricane Grace followed, making landfall on the Yucatan Peninsula on August 19 and a second Mexican landfall on the Gulf Coast near Tecolutla on August 21. In addition, Hurricane Henri made landfall on August 22 near Westerly, Rhode Island, as a tropical storm.
To help you navigate the peak of hurricane season, one of Catalog Viewer’s most anticipated features has arrived and it is sure to enhance your real-time workflow. The Industry Loss at Event-Level tool adds a new layer of analytical capabilities to your real-time workflow, giving you more insight into the potential industry losses in the U.S. all within the same application.
You can filter the 10K catalog of the AIR Hurricane Model for the United States by industry loss level amount to see only the storms that will have a major impact on your business. You can also see the event-level industry insured loss, or the industry insured loss by state-level for a quick glimpse at your potential risk.
Insured Loss Use Case
Now let’s look at one use case of Catalog Viewer’s industry loss feature in action. Palmetto Atlantic Insurance, a fictional South Carolina insurance company introduced in our blog on National Hurricane Preparedness Week, saw that the latest forecast from the National Hurricane Center showed that a storm in the Caribbean was forecast to make landfall in Florida as a Category 3 hurricane.
Palmetto Atlantic Insurance wants to see what the estimated industry losses will be for South Carolina after this storm makes landfall. With Catalog Viewer, they can now see the industry loss at event level for each stochastic event as well as how the losses are broken down by state. To get an idea of what state-level industry losses could be for South Carolina, they use three different spatial filters to find five stochastic events that roughly follow the trajectory of the storm (Figure 1).
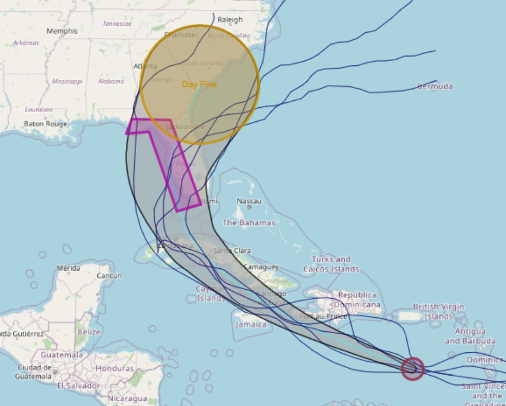
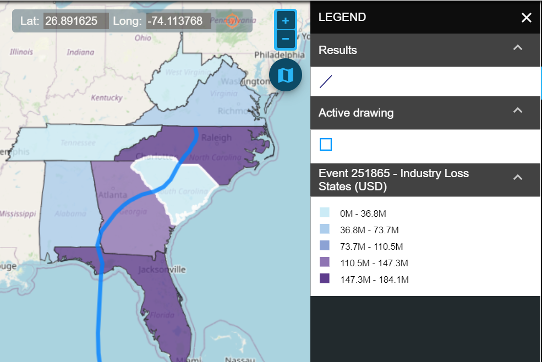
One storm that seems to be following the cone of uncertainty the closest is showing an estimated loss of USD 609 million, but that is still at the event level. To see the industry losses by state-level, Palmetto Atlantic Insurance clicks to expand the table; a color-coded map along with the event’s track (Figure 2) appears as well as a table to give the exact losses. After analyzing the map and the table, they can see that South Carolina has an estimated industry loss of USD 28.9 million for this stochastic event.
Palmetto Atlantic continues to analyze each of the five similar stochastic events (SSEs) that were previously identified and compares the event and state-level industry losses to get a better idea of what to expect from the approaching hurricane. To share all this data and present it to others offline, they simply generate a PDF with the data they need in one report. This PDF will compile all the events with their individual tracks, intensity footprints, and event- and state-level industry losses.
Additional Use Cases
It’s important to note, however, that Palmetto Atlantic Insurance’s use case is not the only way to use the Event-Level Industry Loss tool. Reinsurers can use the tool, for example, to quickly estimate their market share without direct access to any detailed exposures. If they know that their book makes up USD 100 billion of the USD ~2 trillion insured residential property market in Florida, for example, then they can estimate that when they see a state-level loss in Catalog Viewer for Florida is USD 20 billion, then their market share is likely to be ~1% or around USD 1 billion.
Catalog Viewer’s Industry Loss at Event-Level tool provides new analytical capabilities that will provide you and your organization with a better sense of potential risk. Find industry losses instantly when time is not on your side all in one place, anywhere and at any time. Catalog Viewer can help you understand how hurricanes can impact your portfolio, and the new feature can take it a step further. As we head into the heart of the hurricane season, now is the time to prepare for what’s coming.
See Catalog Viewer in action: request a demo