
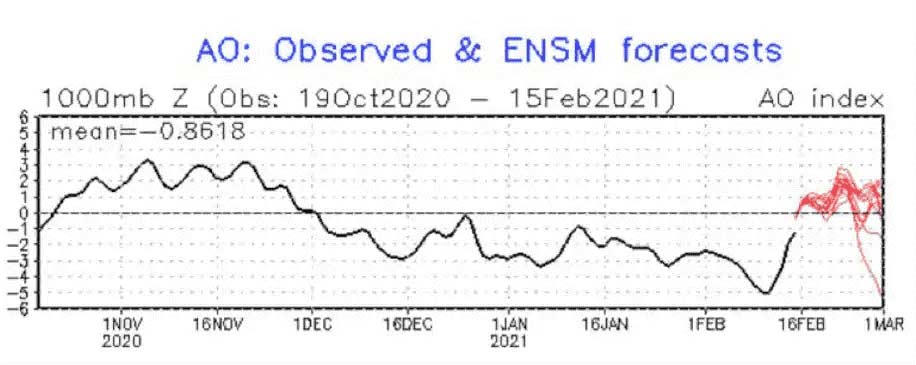
In the second week of February 2021 a confluence of meteorological phenomena combined across the south-central U.S. to create a freeze event that left much of Texas out in the cold. Weeks prior, a chunk of the polar vortex had broken off and begun to traverse the northern U.S., but a full polar vortex cold outbreak never fully materialized as the chunk of cold air remained stagnant. As days passed, this pool of extreme cold air sat in southern Canada as a low-pressure system moved onto the West Coast mid-February (Figure 1). At the same time, a large-scale atmospheric teleconnection called the Arctic Oscillation (AO), which had been negative all season, reached its most negative value of the season.
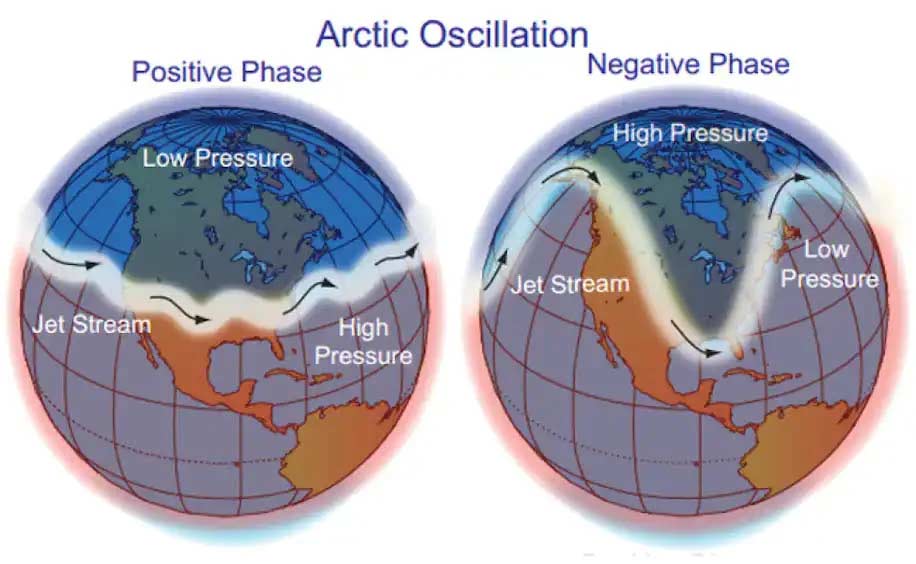
When the AO (a reflection of pressure differences nearer the North Pole) becomes negative, it favors a weaker and more meandering jet stream. Storm systems will move farther south, albeit as perhaps weaker storms than their counterparts with a more northerly jet stream or a positive AO (Figure 2). As a result, the mid-February storm from the West Coast weakened and redeveloped past the Rocky Mountains and into an unusually southern location in the Gulf of Mexico off the coast of Texas.
Given the cyclonic, counterclockwise flow of these systems, this allowed the pool of cold air sitting across the Northern Plains and southern Canada to be funneled down into the Sun Belt and Texas region. The result was a storm somewhat weak in pressure (only dropping to 992 mb) but armed with both plenty of cold air and moisture from the Gulf (Figure 3). The result was widespread snowfall and ice across a region normally spared these events.
Frigid Temperatures and Long Duration Broke Records
The remarkable event resulted in both frigid temperatures and long periods of below-freezing temperatures. While Dallas matched its record low temperature for February 16 at -2°F, the town of Waco actually broke its record for most consecutive hours of below freezing temperatures at 205 hours, or more than 8 days. Waco’s previous record was 150 hours, or more than 6 days, set in 1983.
How Widespread and How Extreme Were These Freezing Attributes?
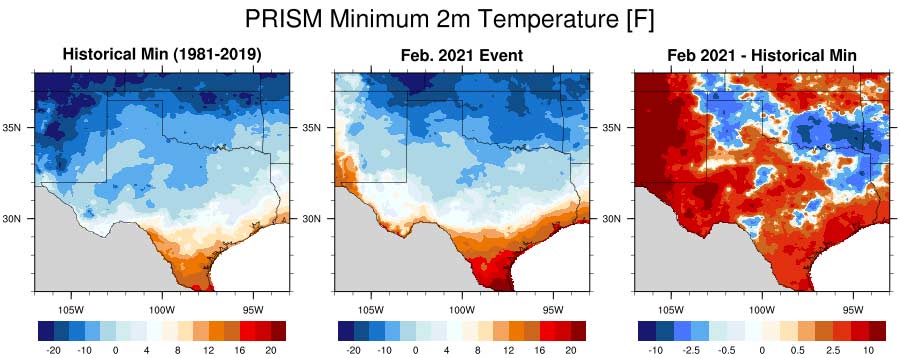
To examine these features of the south-central U.S. freeze event, we used a high spatial resolution (8-km) observational climate data set called the Parameter elevation Regression on Independent Slopes Model (PRISM). This data set provides continuous, daily minimum and maximum temperatures for each 8-km grid cell based on observations and statistical assumptions that help fill in the gaps where observations aren’t available, accounting for topography, climatology, and quality control. The length of record for these daily variables at this high of a spatial resolution is 1981 to the present.
First, we looked at the observed lowest minimum temperature recorded in the historical data set compared to the observed lowest minimum temperature from February 2021 across Texas and Oklahoma (Figure 5). As can be seen, large swaths of southeast Oklahoma and eastern Texas dropped below -10°F to -20°F during the February 2021 event. When compared to the historical record, many areas around the Texarkana region, Wichita Falls, and Amarillo experienced their coldest temperatures by more than 2°F, making the event the coldest in history.
For other regions, such as the Dallas-Fort Worth Metropolitan Region, this cold spell was the second coldest in the recent record; along the Gulf Coast and in the Houston area, the third coldest recorded daily minimum temperature was experienced. In terms of area, about 168,000 km2—24% of the spatial size of Texas—roughly experienced record low temperatures. Of course, the caveat being we assume that an entire 8 by 8 km gridcell would breach the record.
However, the full story cannot be told by simply analyzing the minimum temperatures from the cold blast; the relentlessness of the frigid temperatures ultimately broke Texas’s power supply grid.
To quantify this, we examined the maximum consecutive days during which the maximum daily temperature never exceeded freezing (32°F). Here, the logic is: If the maximum temperature for a day was below 32°F, then temperatures at all hours of that day must have been below freezing as well, and hence we have continuation. Similar to the above analysis, we calculated the maximum consecutive streak of days below freezing across the region for the historical record as well as the February 2021 event (Figure 6).
Clearly visible is the large swath across central and eastern Texas where this record was smashed. From Odessa through San Angelo in the west and across the San Antonio region in the south, the cold spell ranged from 48 to 96 hours longer (2 to 4 days) than ever experienced. At Austin’s international airport in the north, for example, consecutive records were broken by more than 52 hours or 2+ days (6.8 days versus 4.6 days). An area of about 354,000 km2, or roughly 51% of Texas, experienced temperatures below freezing for a record duration.
The persistent extreme cold temperatures caused a prolonged period of increased energy demand for heating homes and businesses across the state. If we look at where records were broken (Figure 7), we see that across much of the northern Panhandle and Texarkana region, the lowest observed temperatures on record can now be attributed to the freeze event of 2021, while across most of the central and southern region the longest duration below freeze occurred this past February.
Of course, the hardest hit regions—some 67,840 km2 (10% of the state’s area) where both extreme temperatures and duration occurred—were around some of the more populous cities of San Antonio and Austin. Nevertheless, a substantial portion of the state—approximately 65% (about 453,312 km2)—either broke a record for lowest temperature recorded or most consecutive days below freezing. Hence, the 2021 freeze event was remarkable in not only its magnitude of extreme temperatures but also its duration in time; therefore, its spatial impact may be unparalleled for the State of Texas.
With 100 million+ Americans affected, as of February 16, the country set a new record for the largest amount of the U.S. ever blanketed in snow, 73% of the nation (since 2003 satellite records were kept) for that date. From Washington to Maine to Texas, the winter storm of mid-February 2021 is a strong reminder of the shear mass (and scale) of disruption and destruction that extratropical cyclones are capable of.
While no one weather system or event can be directly attributed to a changing climate, several of the atmospheric ingredients that helped create this unique storm setup may become more frequent under a future, warming climate. Research has shown that the atmospheric conditions for polar vortex disruptions, such as weaker and more wavering jet streams, as well as sudden stratospheric warming, may have been increasing in our more recent climate and some work has even shown that a warmer climate may result in more of these Arctic features. For example, these conditions may be related to a reduction in Arctic sea ice or an increase in heat transfer from the tropics to the Arctic via atmospheric rivers.
From these relationships and trends, one could infer that the Texas freeze event may become more common in our changing climate system. However, via both observations of the climate record as well as simulations from climate models, the debate is far from settled over global warming’s effect on the Arctic’s influence of mid-latitude winter climate.
Nevertheless, the Texas freeze event highlights a key non-atmospheric player that will certainly require more consideration: the unique infrastructure of power and network grids and their vulnerability to atmospheric perils. Here, Texas’s lack of connection to any other national grid to share or accept power, as well as the vulnerability of its grid’s equipment to extreme ice and cold highlight the need to consider the consequences of network failures and government-applied rolling blackouts, both of which have large implications for property and casualty losses.
Advance your risk management capabilities with AIR extratropical cyclone models