


In 2020 the U.S. hurricane season began with many uncertainties about how claims and loss inflation would be impacted in the middle of a pandemic. As we kick off the 2021 U.S. hurricane season, I will briefly review the data we had going into last year’s hurricane season; the experience in the construction labor and materials market over the past year; and the lessons learned. I will then discuss the current market conditions and what they could mean for this season.
What Happened in the Labor Market?
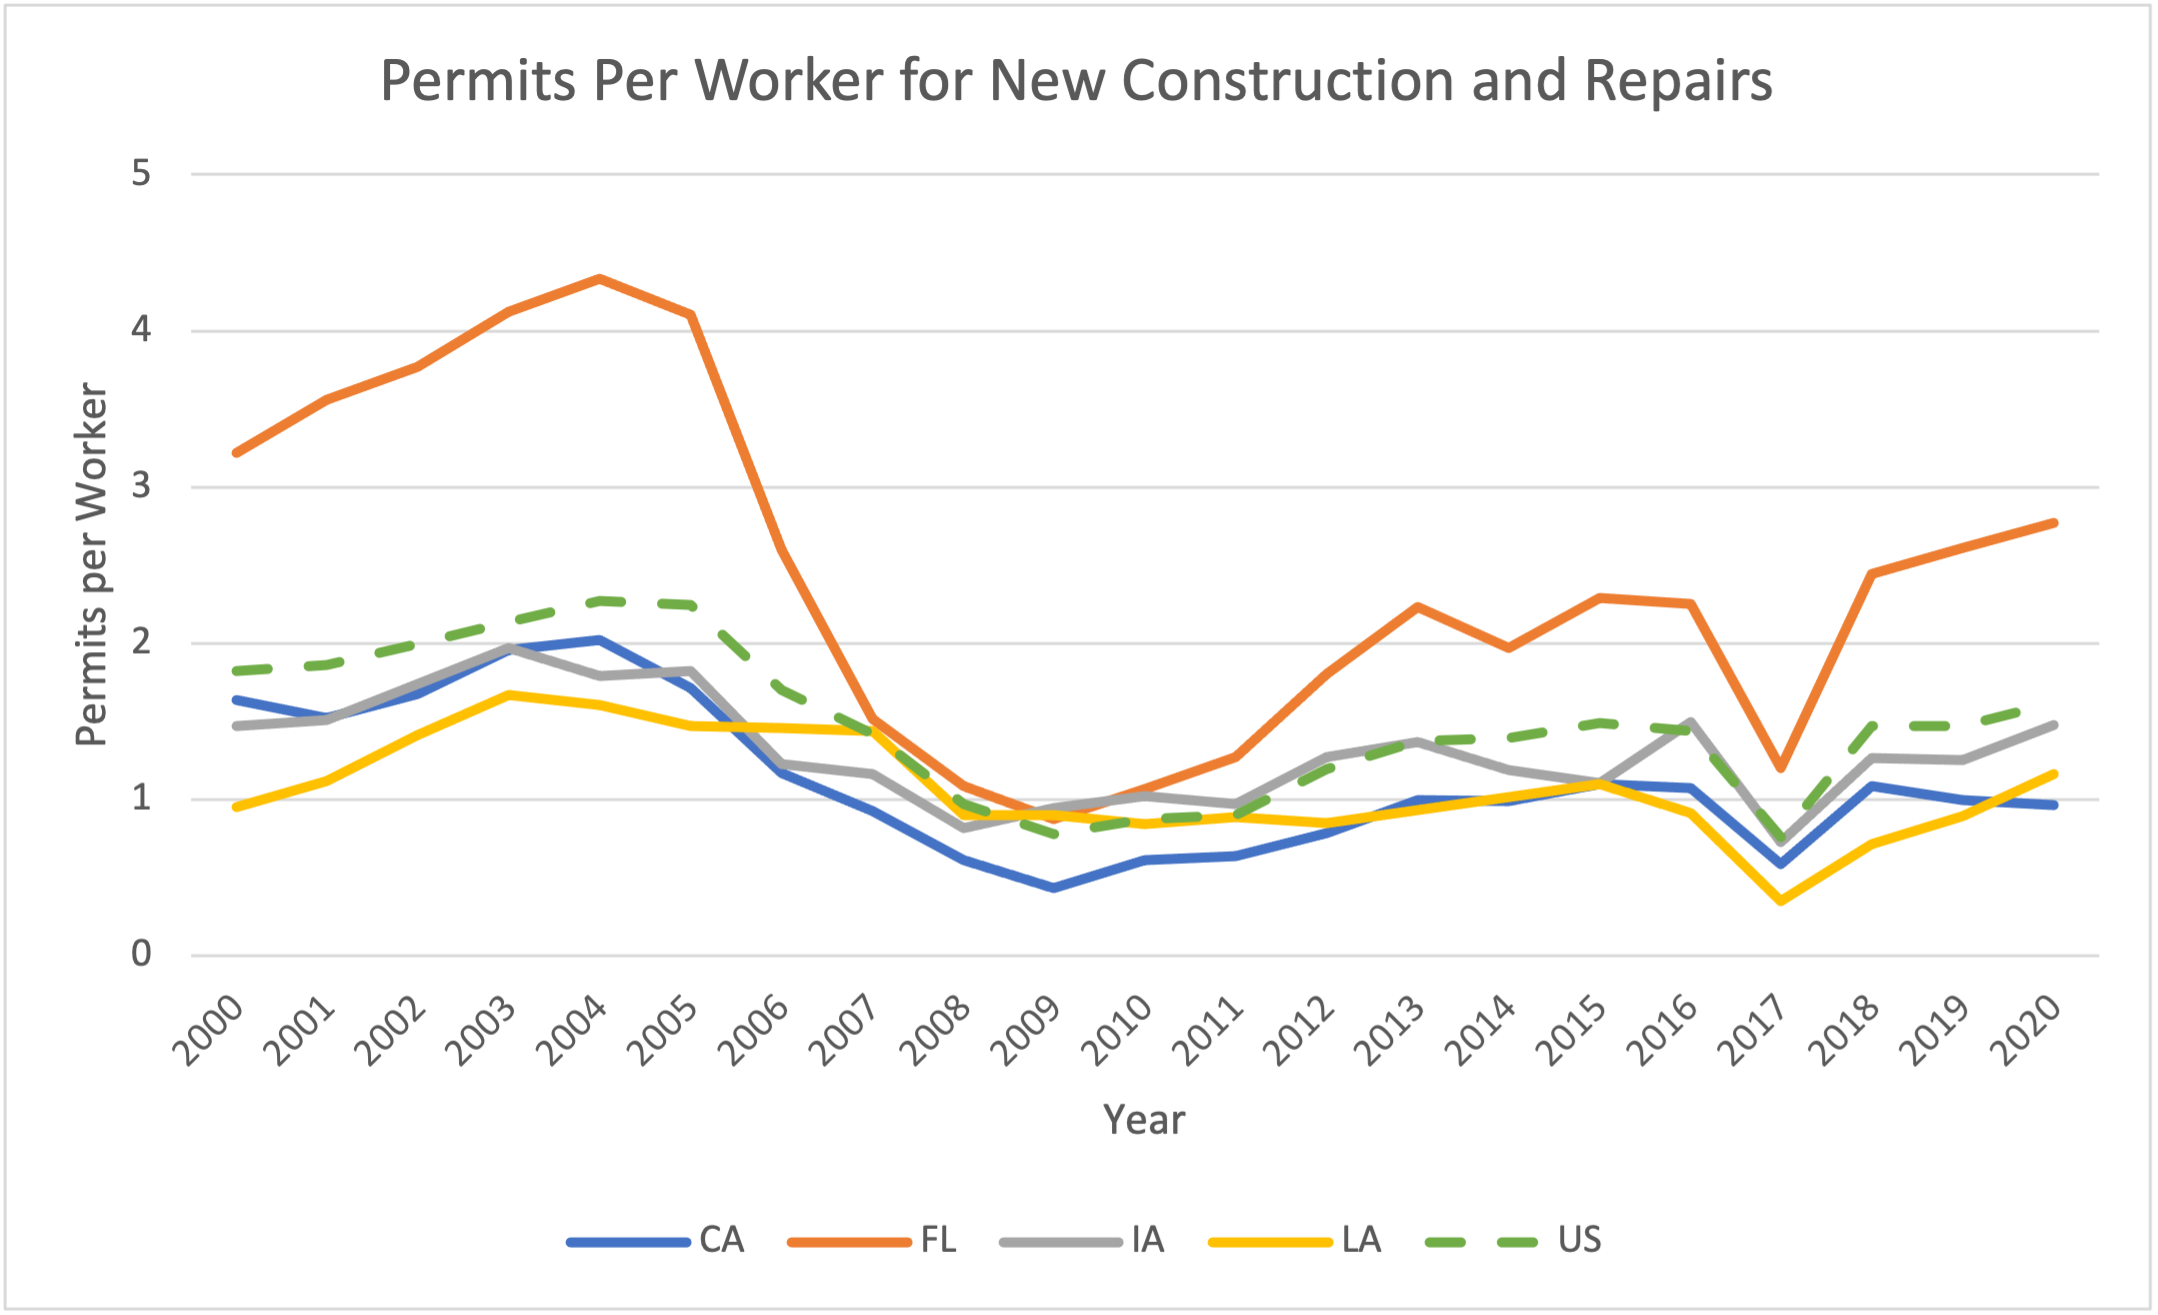
Last year we looked at the permits per worker as a forward-looking measure of demand for labor. This metric includes permits for new construction as well as repair work inclusive of the impact of any natural catastrophes. At that time, we saw moderately increasing future work for some Southern states leading up to the beginning of 2020. Elsewhere the trend was down, leading to flat growth nationally. In Figure 1, we can see the same chart with the data through the end of 2020 showing what happened and an indication of what to expect in 2021. This chart looks a little different from others that have preceded it because it includes areas that were significantly impacted by extreme events in 2020. The national trend is also included to show the impact of moderately increased activity nationally. You can see that the trend was mostly unremarkable during 2020, not the level of work we associate with rising prices. Before we look at how labor costs responded during the pandemic, we need to look at how the anticipated workload contributed to construction spending.
In Figure 2, you can see the construction spending time series by sector from January 2015 to January 2023. This chart is from the Construction Analytics website and the data in the chart is a combination of publicly available data (residential) and private data (non-residential). The actual spending is included through March 2021 combined with the value of projected spending through January 2023. The vertical axis shows nominal spending in billions of dollars, and the horizontal axis shows the major biannual time periods. The beginning of the pandemic is indicated by the dashed vertical red line, and the beginning of the projected data is indicated by the solid purple vertical line. Let’s focus on the residential and the non-residential spending. On the residential time series, the shape of the curve should come as no surprise. Spending dropped sharply in the second quarter of 2020 then began increasing in the third quarter before peaking at the end of the fourth. Future residential projected spending is expected to level off with modest increases through the beginning of January 2023.
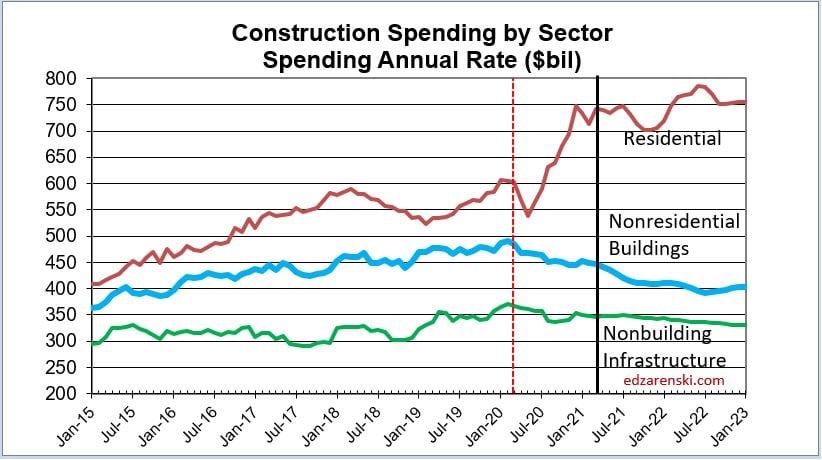
For non-residential buildings, spending had leveled off during 2019 but started decreasing for all of 2020 and is projected to continue decreasing through January 2023. If we just consider the nominal value of spending, overall construction spending increased over 2020 at a modest 5%. To understand what this means for jobs, we remove the inflation from nominal spending to get real spending, or construction volume. Rather than an increase, the real spending saw a decrease over 2020, indicating a drop in construction while overall prices were rising dramatically. The Construction Analytics website does a good job of explaining how construction volume when converted to work hours/jobs translates to decreasing jobs over 2020 and will continue to drop through 2021.
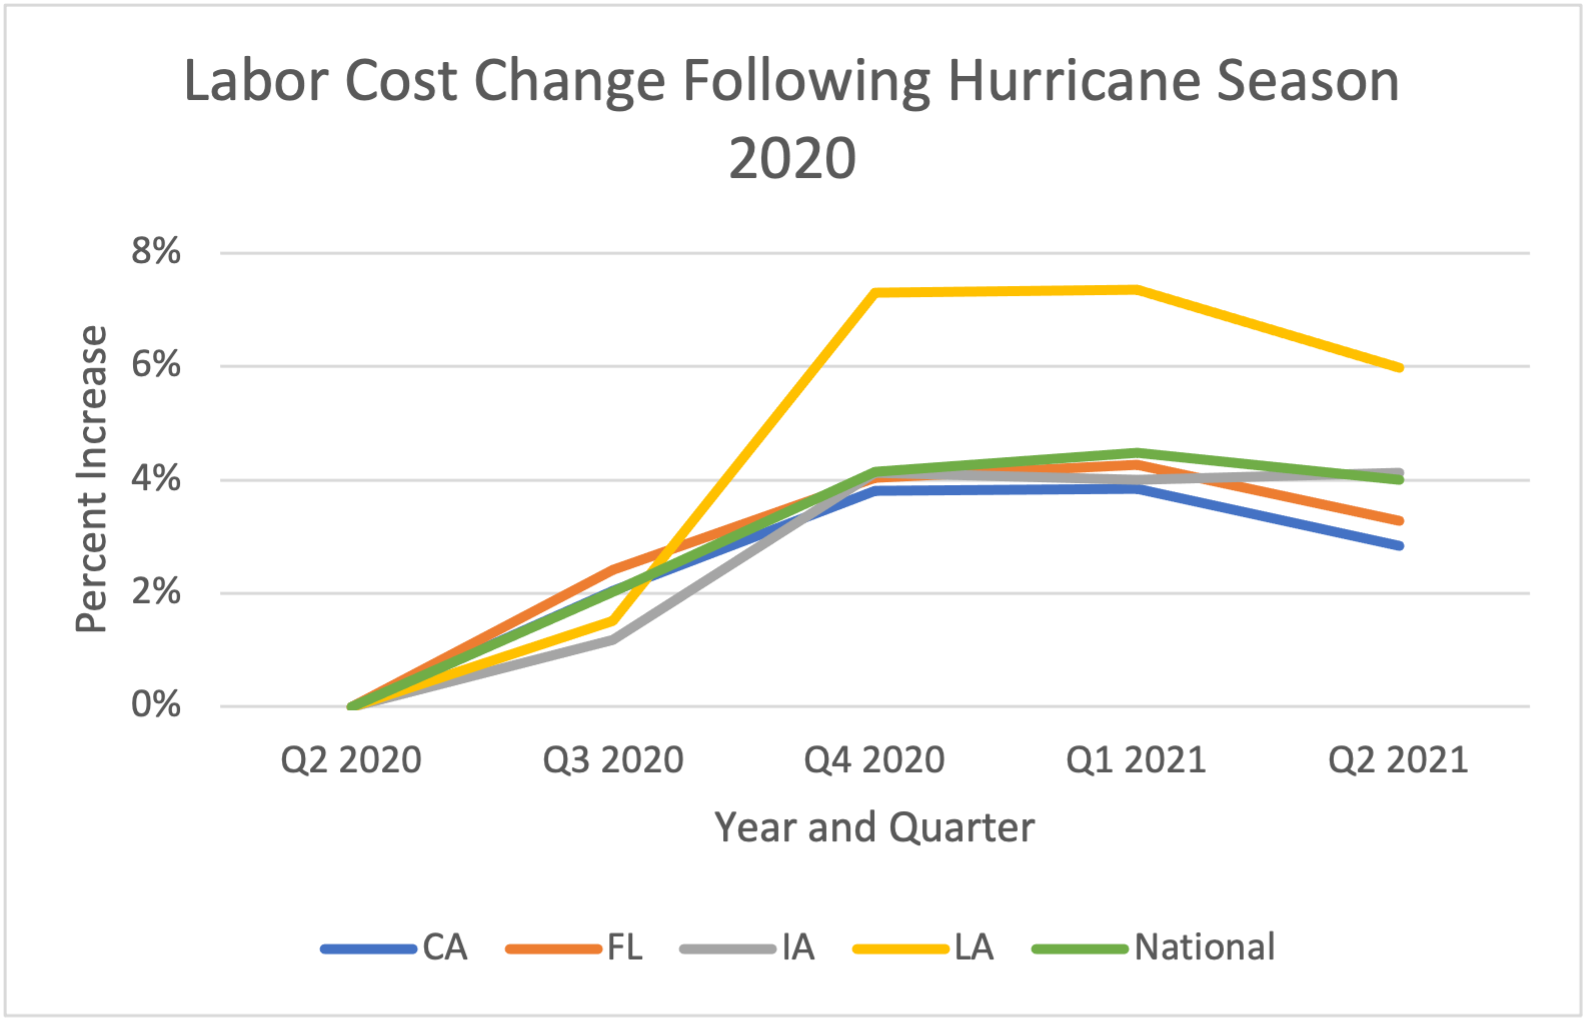
In Figure 3, we can see the impact on labor costs for each of the affected states. The year-on-year increase can be seen at the last point in the chart, Q2 2021. California, Florida, and Iowa all follow the national trend, which tells us that there were no significant disruptions to the labor market. In Louisiana, however, we can see a spike in labor costs starting in Q4 2020 that is only moderating now. This should come as no surprise given the active season that affected the Pelican State; this spike is consistent with our view of demand surge last year in a COVID-19 labor market—that we should expect what we would in any other hurricane season. Because claims are settled over time, demand surge can be viewed as a weighted quarterly average over the same period. Assuming the claim settlement is uniformly distributed over four quarters, we can calculate the average impact on labor, which better reflects demand surge. Normally the year-on-year change shows the biggest increase because price levels have already started coming down; the year-on-year price level escalation is equivalent to the weighted demand surge. This has implications for how to interpret the sharp increases in construction materials costs, which I will discuss in the next section.
As we head into hurricane season 2021, the economic fundamentals for the construction market in our sample of states suggest nothing extraordinary. The demand for construction is currently moderate and labor cost inflation is consistent with the last four years. Like last year, for economic demand surge related to local labor market disturbances, you should expect what you would in any other season.
Materials Cost Inflation: Was It Demand Surge or Just a New Price Level?
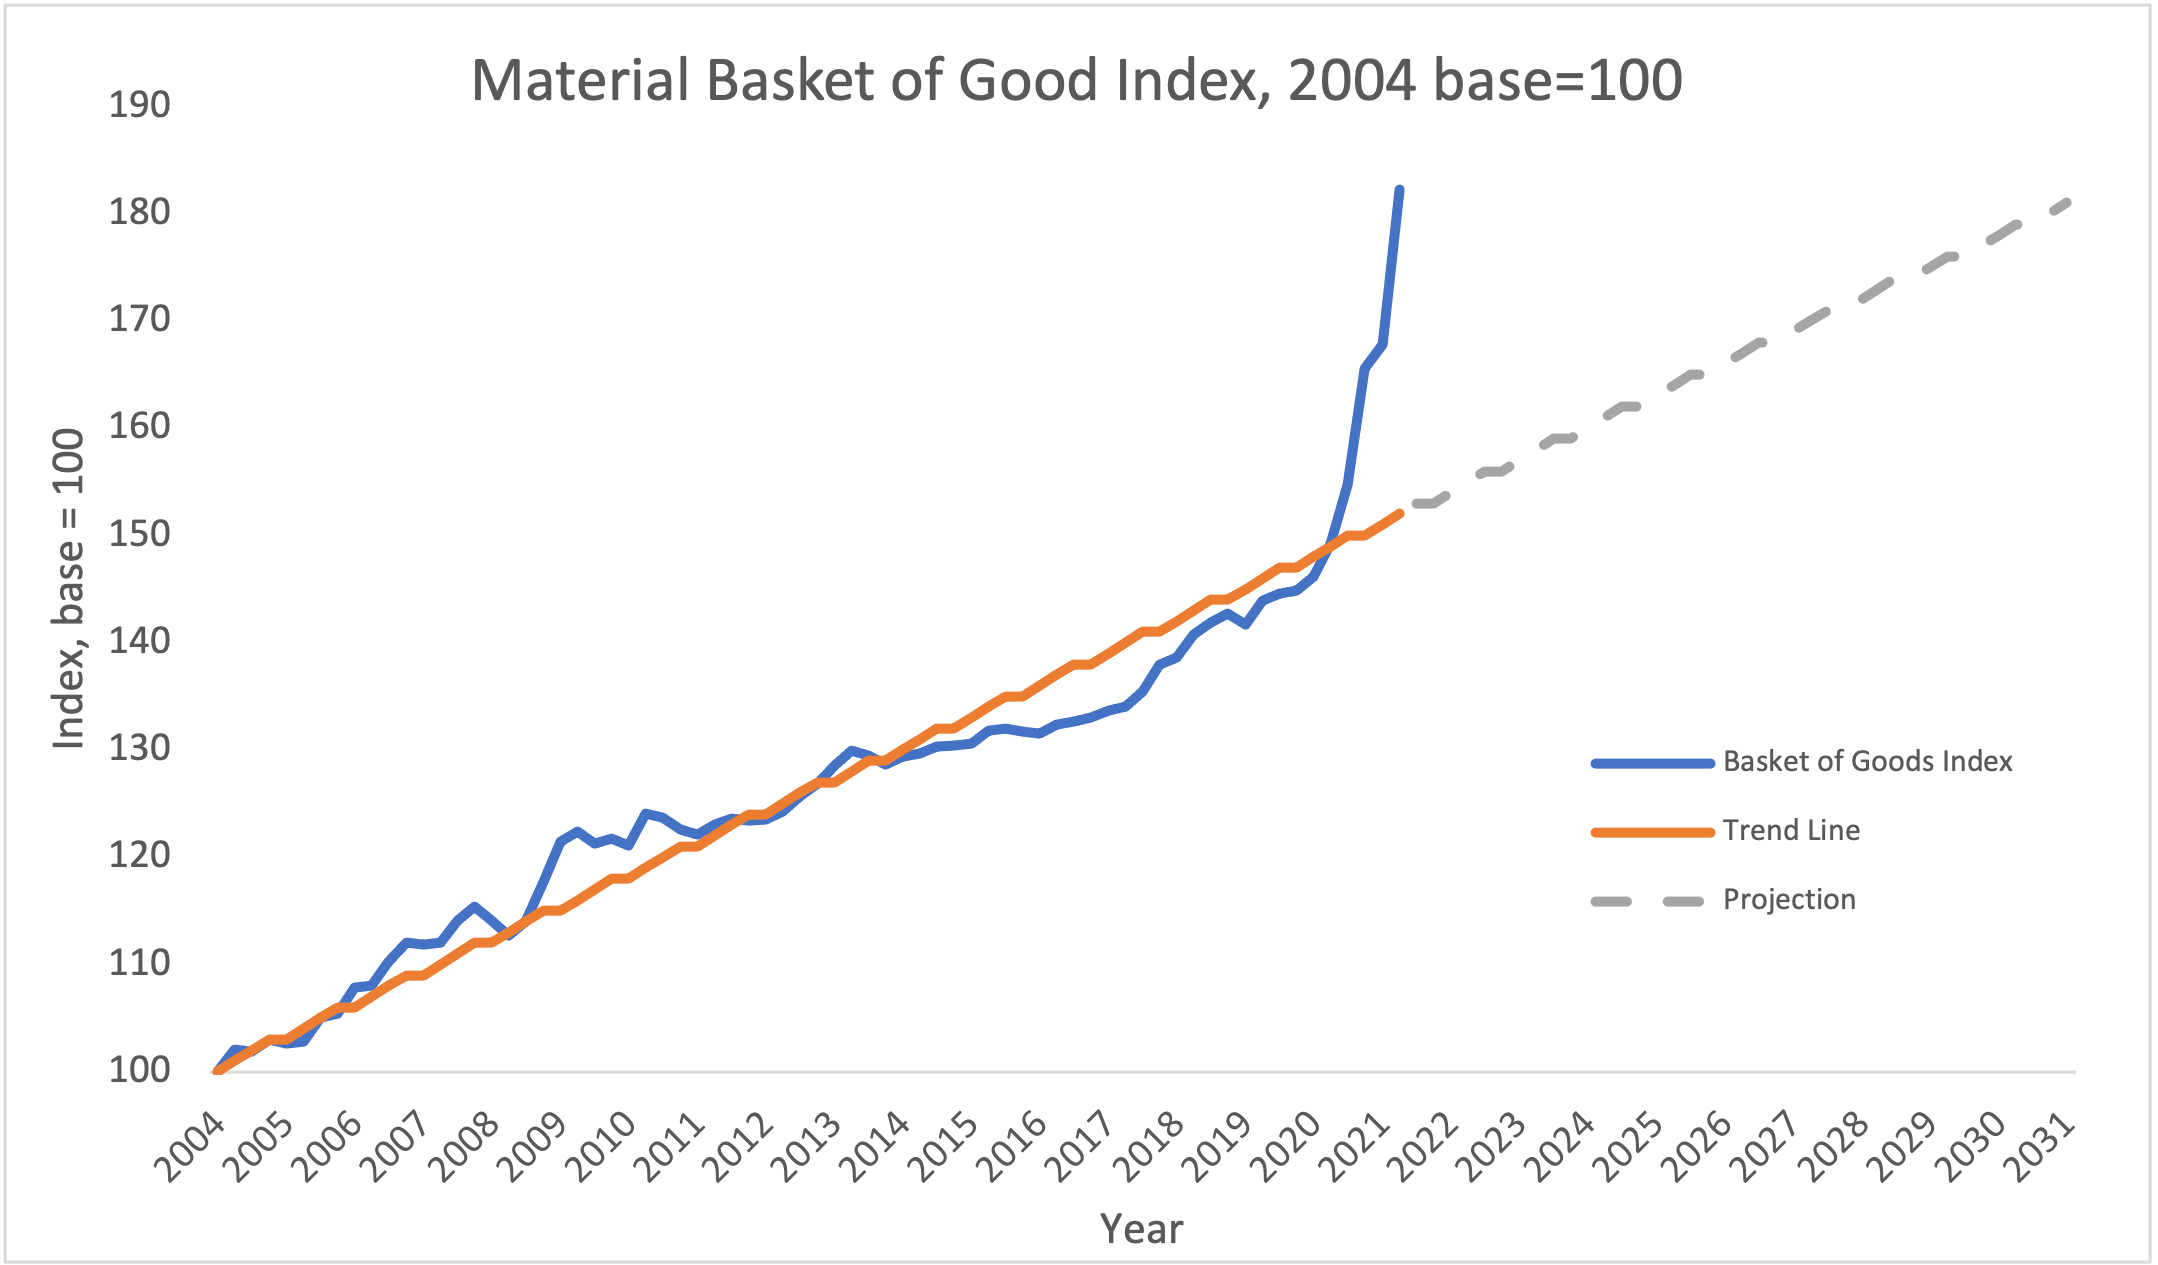
The headlines announcing the triple-digit increases in the cost of structural lumber over the past year have been hard to miss. Less well-known are the price increases for steel, aluminum, and other metals critical for building construction. Individually they have been the focus of concern over the cost of construction, but these materials are just one component in the mix of materials used for constructing a home or office building. Figure 4 shows the Market Basket of Goods used in construction converted to a national index with a baseline=100 from Q1 2004 to Q2 2021. A trend line in blue has been added along with a 10-year trend projection. Over the past 15 years we have seen a steady increase in the cost of construction materials, which until 2020 was about 2.4% per year. The annual increase between Q2 2020 and Q2 2021 has been a whopping ~15%, but the price elevation started before the hurricane season. If the trend had remained steady, it would have taken until 2031 to reach the same level.
There have been points in time where the individual components spiked in price, but none were significant enough to affect the basket of goods. What was different in 2020? The production of lumber was reduced early last year in anticipation of reduced demand during the 2020 construction season caused by the COVID-19 pandemic. The intent in reducing supply is usually to maintain the existing market equilibrium and create stable prices that would benefit lumber manufacturers. At the same time the supply was reduced, however, demand for construction increased and surprised the market. The effect was a spike in prices before the 2020 hurricane season started, triggered by not only the wildfires in California but also the unexpected surge in new housing and other construction.
As we’ve seen the permits per worker indicate there wasn’t enough severe repair work to drive up the cost of labor let alone materials. We must look for evidence that the cost increases may result from other sources of demand that are not well documented, such as do-it-yourself (DIY) construction projects that do not require a permit. The lack of corresponding permitted projects is the strongest evidence I can find to support the importance of DIY in driving up the cost of some materials.
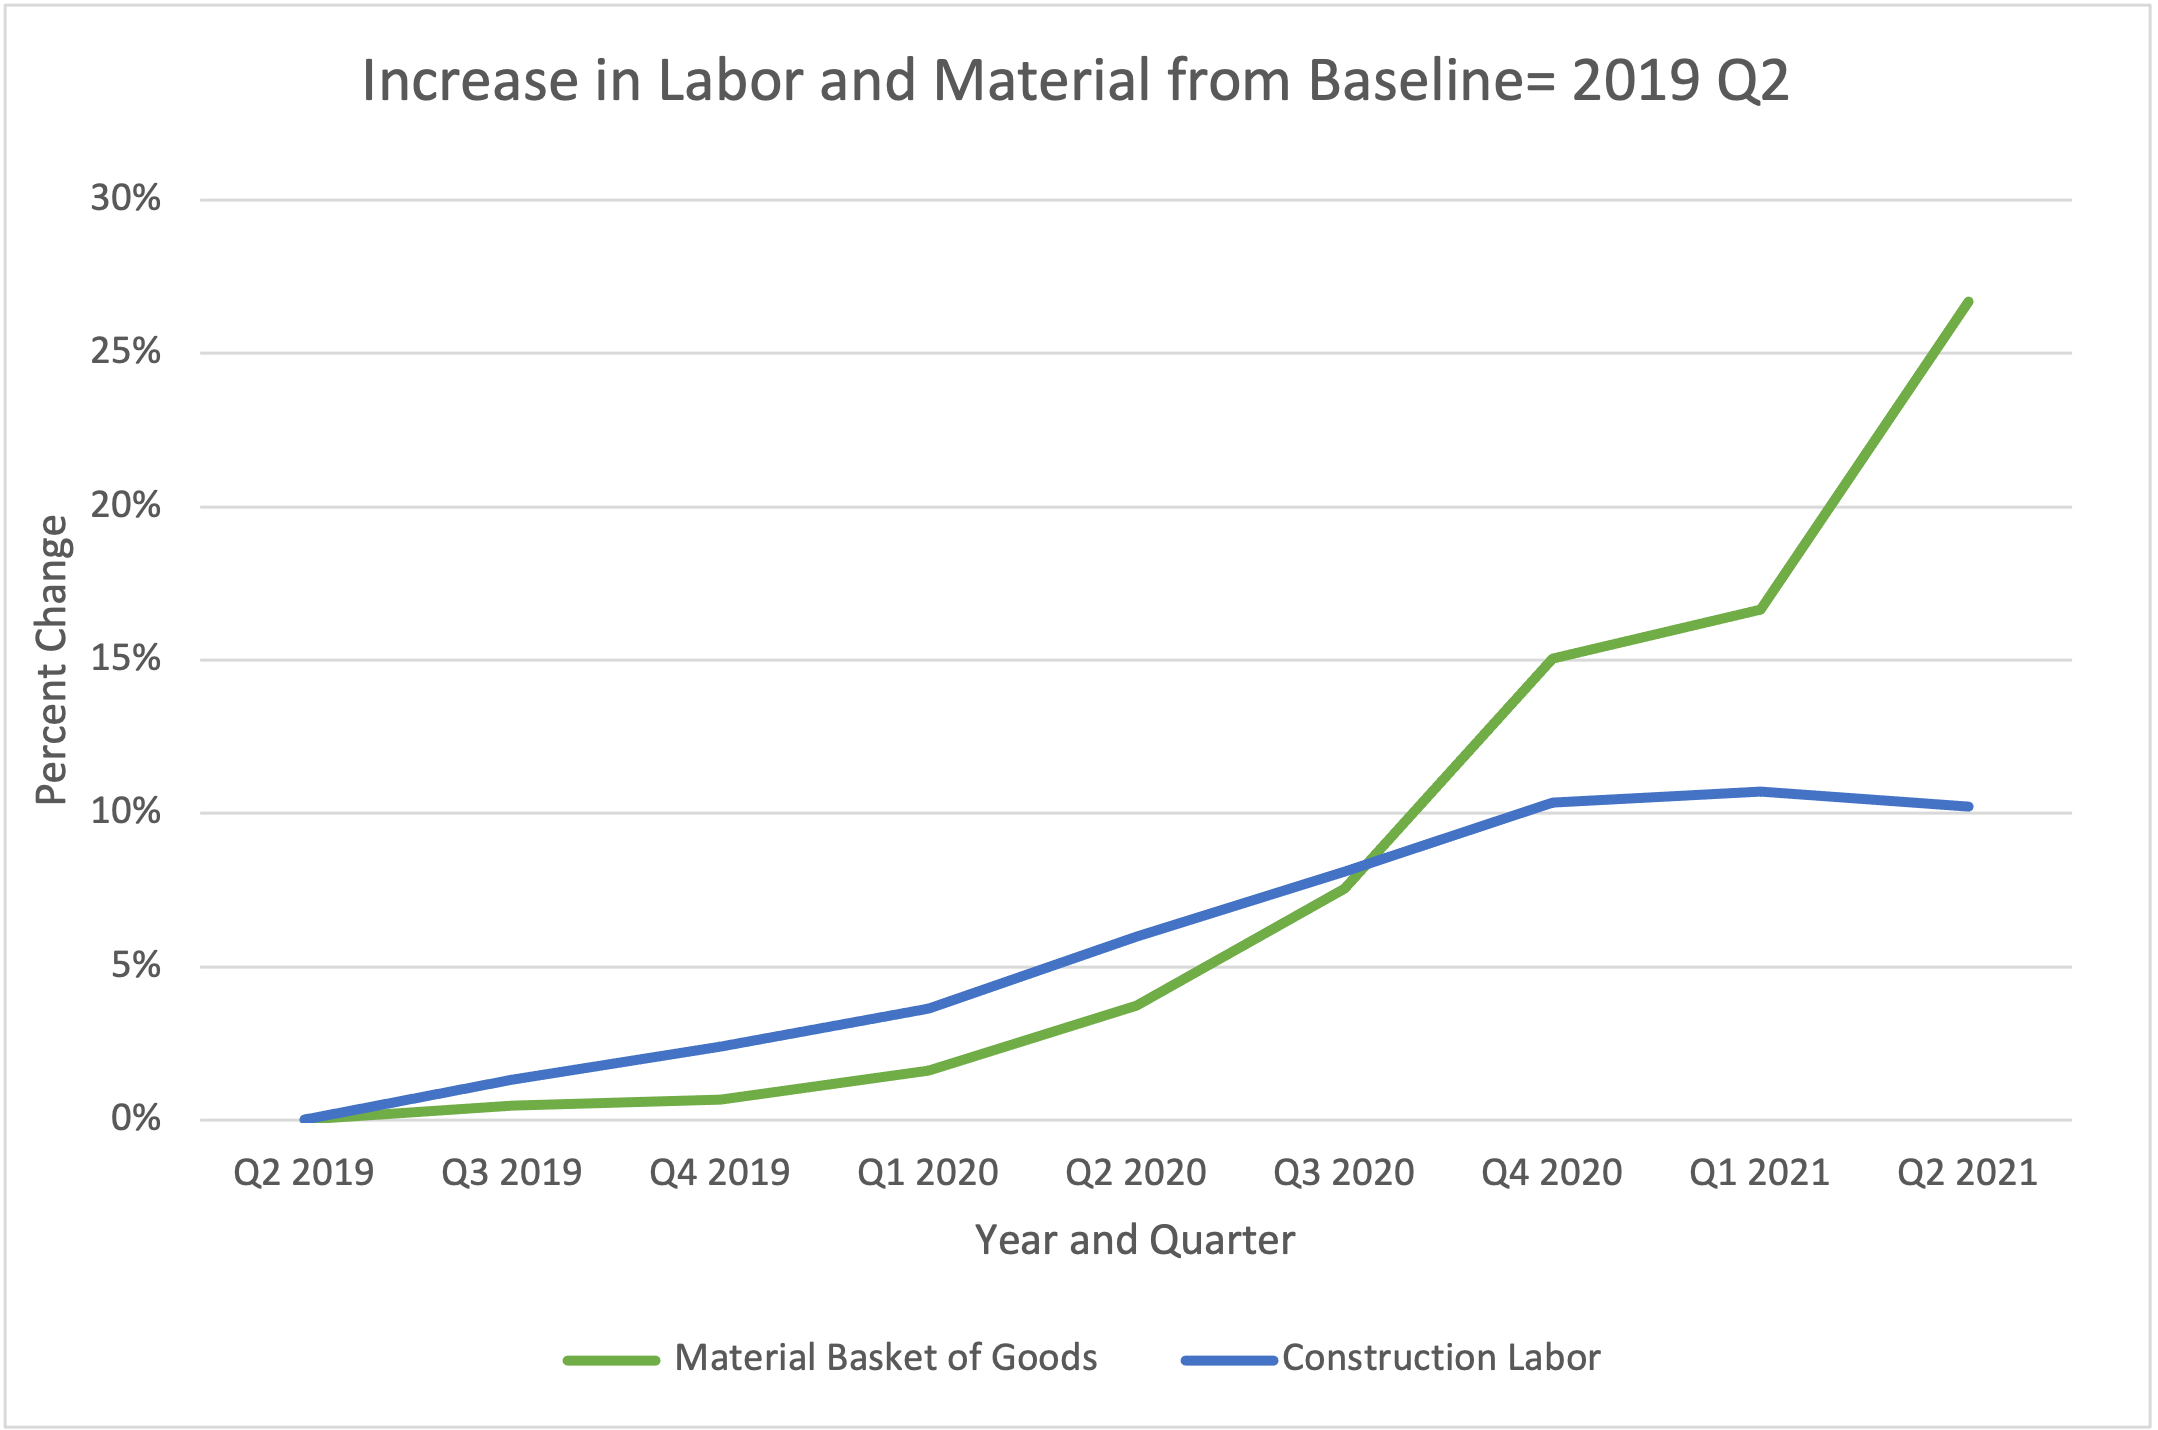
Figure 5 shows the relative changes in national construction labor and materials costs over the past two years. Both trends remain steady for five quarters before something unusual happens in Q3 2020. The shift in the materials cost increase is subtle, but there is a marked upturn before the heart of the hurricane season. The following quarter costs spike and could be attributed to the landfalls in Louisiana. The problem is that we do not see a big increase in permits, which suggests this is still a supply issue rather than a demand issue. Between Q1 and Q2 2021 another spike with no corresponding extreme events provides more support to the supply chain constraint hypothesis.
There is a lot of anecdotal evidence that points to supply chain bottlenecks. First there are the limitations of the mills. It has been reported that most are running at capacity, although idled mills are still coming back online. Building new mills may seem like a solution, but that takes time and there may be limitations from equipment that runs on microchips (another supply chain bottleneck). The next step is the process of kiln drying. If the capacity of the kiln for drying structural lumber doesn’t match the output of the sawmill, this can be a significant bottleneck. On the logistics side, lumber wholesalers are not interested in keeping high-priced product on hand waiting for a buyer in case the price should drop. All this adds up to the supply chain delays that can put off construction and delay claims.
Until there is a downward trend in DIY projects or more materials manufacturing capacity comes back online, prices should stay elevated for inputs such as structural lumber. Because the DIY work is undocumented in most cases, we won’t know about its impact on prices until after the fact. In the past few months there have also been calls to drop the 20% tariffs on Canadian lumber. If that’s successful, it may motivate domestic suppliers to increase output and drive costs down, but it probably won’t happen before the hurricane season 2021 starts in earnest.
The Bottom Line: What to Expect for Hurricane Season 2021
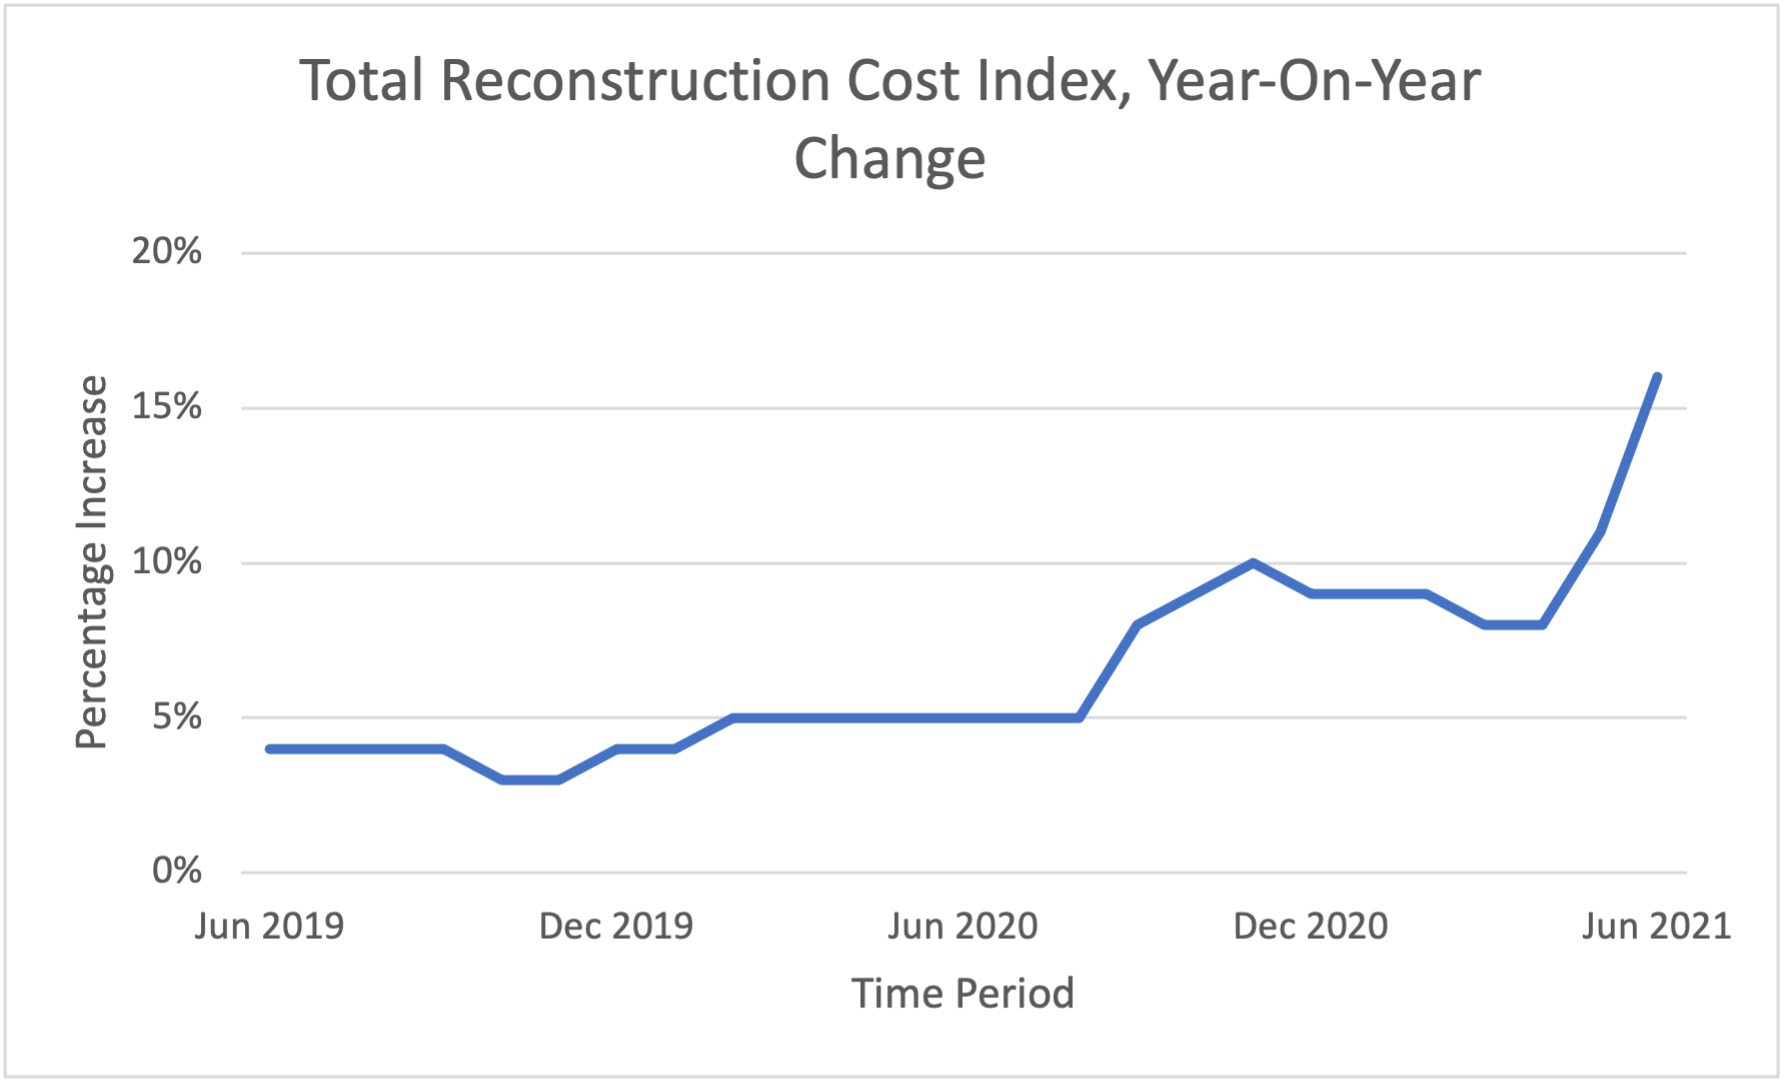
Over the past year, reconstruction costs have gone up quite a bit, mostly driven by lumber, but also other materials used in construction, such as steel and gypsum, especially in this last quarter from supply chain disruption in the construction market. We usually look at labor and materials trends, but what matters for claims settlement are repair costs and these have gone up significantly since June 2020, with a big jump in just the last two months. Figure 6 shows the year-on-year change in the national total reconstruction cost index from Xactware. This index shows the national average increase of rebuilding for extreme events that cause near or total loss. The year-on-year change can give us a worst-case view of the possible increase in claim costs, all else being equal, and offer a guide for what to expect. Prior to September 2020, the year-on-year change was stable at between 4% and 5%. As materials costs started to increase in the final months of 2020, the year-on-year change made a significant jump. Until April 2021, the increase was between 8% and 10%, but by June 2021 it shot up to about 16%.
The bottom line is reconstruction is simply more expensive today than it was a year ago. The increase in the total reconstruction cost index means that costs are higher on average nationally; this affects the low- as well as the high-severity events. The difference in magnitude of the impact will come from the mix of construction materials used. For example, minor wind losses are less likely to require repairs that use more expensive inputs such as structural lumber; however, dwellings that are a total loss would require a broader mix of inputs that reflect the higher increases indicated by the total reconstruction index. If we have the same type of season in 2021 as we did in 2020, you should expect the average claim to be higher before considering demand surge.
The costs are cyclical and there is nothing to suggest they will increase by the same magnitude as the past year. After an extremely active hurricane season in 2004 there was a big spike in materials prices. Hurricane season 2005 was just as active but the increase was more modest and eventually materials costs reverted to the long term, which is the most likely scenario today. In Figure 4, the historical materials cost experience was shown with the trend to 2021 and the likely cost projection over 10 years. While we should expect the costs to come back down at some point, we should not expect them to revert to 2020 price levels. It is most likely that we will see supply and demand adjustments from the market disturbances we have seen over the past year leading to a new price equilibrium consistent with the long-term trend. So, we may just be looking at higher costs in general and do not want to conflate it with loss inflation. As this year’s hurricane season unfolds, I will keep interested readers apprised of the situation.
Quantifying supply chain risk is hard. We make it easy. Book a free consultation.
