


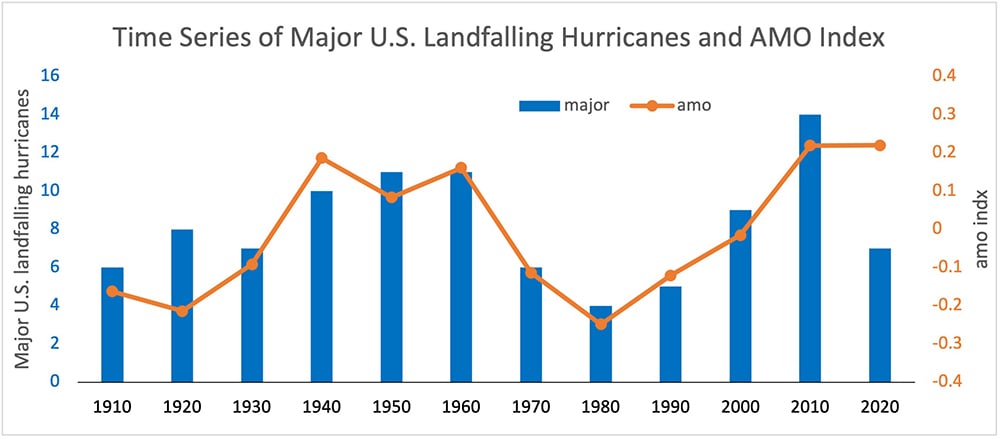
The influence of slowly varying Atlantic Ocean sea surface temperatures (SSTs) on North American hurricane activity has been recognized almost since the Atlantic Multidecadal Oscillation (AMO) was first labeled as such at the turn of this century. The AMO is a reference to the 60- to 70-year oscillation found in Atlantic SST records going back to the 1850s. When SSTs are anomalously high (positive phase), hurricane activity in the North Atlantic is increased; there is a strong correlation between the AMO Index (a quantitative measure of the temperature anomaly) and the number of major U.S. hurricane landfalls (Figure 1).
In 2007 this correlation prompted AIR to develop its warm sea surface temperature catalog (WSST) to help clients better understand hurricane risk under anomalously warm sea surface conditions. At the time, the phenomenon was believed to be the result of internal forcing—natural climate processes primarily driven by a large-scale ocean circulation known as the Atlantic Meridional Overturning Circulation (AMOC). The AMOC is a complicated trans-hemispheric circulation driven by temperature and salinity imbalances (both influence water density). The Gulf Stream, which brings bathwater-like temperatures as far north as Cape Cod and helps moderate the climate of the UK, is part of the AMOC.
The AMO has been identified to have even farther-reaching effects, including influencing temperature and precipitation patterns over much of the continental U.S. and influencing climate on other continents as well. In short, a lot rides on the North Atlantic SST perturbations, so it is important to understand what really drives them.
Volcanic Influence?
The modern-day AMO index only extends back to 1850. While this may seem like a long time, during that period there were only two full negative phases sandwiched between two-and-a-half positive phases. The second full positive phase spawned a very active period of hurricane activity from the 1920s to the 1960s, which includes six of the top 10 (insured) loss-causing hurricanes for the U.S., if they were to recur in today’s economy with today’s exposure. The third positive phase has coincided with some record-breaking storms—if not entire seasons—and apparently this phase has not ended yet.
In just the last decade, the relative importance of the AMOC compared to other forcing mechanisms has been scrutinized. A near debate has been brewing as to whether the AMO’s “O” should really be a “V” for “variability.” The difference is more than semantic (or alphabetical) because an “O” implies internal forcing and a “V” implies more random external forcing. Other external forcing mechanisms—including anthropogenic warming, sunspot activity, dust blowing off the Sahara Desert, and volcanic eruptions—have also been found to influence what scientists are now acknowledging as Atlantic Multidecadal Variability (AMV).
The impact of volcanoes on weather and climate has been documented extensively dating back to the time of Benjamin Franklin, who made a connection between the very cold summer and winter of 1783–4 and volcanic haze from a prolonged eruption of Mount Laki in Iceland. The ash and sulfate compounds ejected by that volcano blocked sunlight for months (there may have been other factors involved in the cold winter across the eastern U.S.). The 1815 eruption of Indonesia’s Mount Tambora not only led to 1816 being referred to as “the year without a summer,” but also contributed to a cholera pandemic, gave birth to international opium production, and triggered an economic depression in the U.S.
In general, powerful volcanic eruptions in the tropics—like that currently occurring on the Caribbean island of St. Vincent—have the best chance for injecting ash and aerosol-generating sulfur compounds high into the stratosphere and to cool the planet. The eruption in June 1991 of Mount Pinatubo in the Philippines was the last such big eruption. It generated the largest amount of sulfur dioxide of any eruption in the 20th century and cooled the Earth for about three years by about 0.5° Celsius.
Volcanic Eruptions’ Potential Influence on SSTs Is Complex
The way that volcanic eruptions could be influencing Atlantic SSTs, however, may be a bit more complicated than simply blocking sunlight for a few years. A 2018 study concluded that the ash and sulfate aerosols that formed in the stratosphere from tropical volcanic eruptions caused tropical latitudes to warm at upper levels and enhanced the pole-to-equator temperature gradient, which strengthened the North Atlantic subtropical high. The stronger winds around the high not only induced evaporative cooling of the underlying sea surface, but also increased Saharan dust transport off the African continent, which further blocked sunlight over the tropical Atlantic, causing more cooling there. Although there was no mention of the AMOC in this intricate sequence of events, it is likely that it too was affected.
And, in case you are wondering, active volcanic periods in the last century extended from the late 1800s to the early 1920s and from the mid-1960s to the early 1990s, very nearly coincident with the negative phases of the AMO index. The second negative phase was also likely augmented by anthropogenically generated sulfur-aerosols, which have since been dramatically reduced.
A subsequent study that used proxy data from tree rings to extend the AMV record back to the year 800 found, however, that volcanic eruptions and sunspot minima explain only 30% of the of the variance in the reconstruction on timescales greater than 30 years. The remaining variance was found to be the result of internal forcing but not necessarily entirely from the AMOC. And in March 2021 another article was published that noted that radiative forcing from volcanic eruptions is exclusively responsible for the AMV over the last millennium, superimposed on the backdrop of more recent global climate change impacts. This study examined output from the Last Millennium Climate Reanalysis Project, which uses the models from the Coupled Model Intercomparison Project Phase 5 (CMIP5) to simulate the climate over the period 800-2000.
Imperfect Relationships and Insufficient Reliable Data
There is some irony to the fact that the lead author of the study that just pronounced the AMO dead was the same one credited with coining the phrase some 20 years ago. But, the debate about what causes Atlantic sea surface temperature variability may not actually be dead.
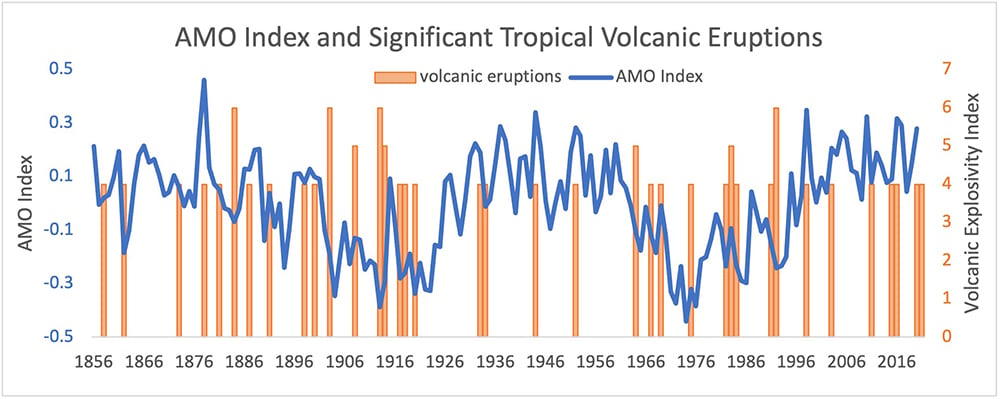
For one thing, there is no denying the existence of the AMOC, as it has been both observed and modeled. But what drives it, how climate change may continue to influence it, and how it may affect Atlantic sea surface temperatures will undoubtedly be topics for further study. For another, the relationship between major Northern Hemisphere tropical volcanic eruptions and the AMO is good but not perfect (see Figure 2). Lastly, it is important to remember that climate models are also good but not perfect.
The very nature of multidecadal cycles indicates very few cycles with reliable data. Superimposed on all of this complexity is the steady creep of climate change. More heat is being absorbed by our planet’s air, land, and water. If volcanoes are the only thing that stand between warming Atlantic SSTs and active Atlantic hurricane seasons, then we may be at their mercy for the next quiescent period. Finally, regardless of what degree (literally) volcanoes can cool the planet to and how, they would have to fight an uphill temperature battle to do so for the better part of the rest of this century.
