
Multiple peril crop insurance (MPCI) is currently the most common form of crop insurance in China. Unlike property losses, which are often caused by singular events over relatively short periods in localized areas, crop losses are frequently due to multiple, interacting perils that develop over an entire growing season and impact large areas, such as flood, wind/hail, frost/freeze, typhoon, and drought.
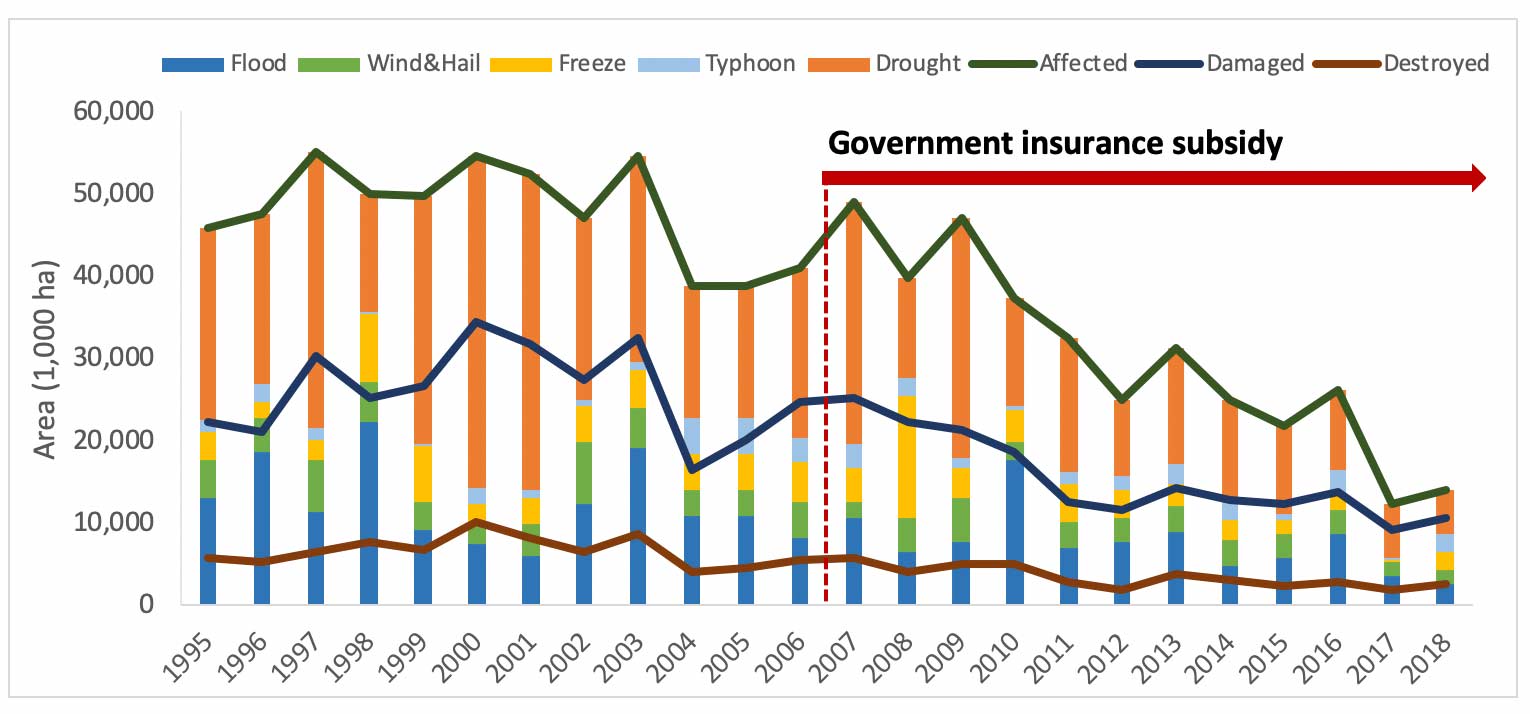
While drought has been the dominant driver of crop losses in China in most years, other perils have overtaken it on occasion, as was the case in 2008 when a series of winter storms early in the year impacted typically warm parts of central and southern China and caused significant frost/freeze damage to crops (Figure 1). Given the size of the country and the various climates within it, which peril drives crop losses in a given year depends heavily on geographic location.
Limitations of Historical Data for Understanding Today’s Risk
The current state of weather/climate science does not offer the kind of accurate and precise predictions for next year’s weather that would be necessary to estimate next year’s losses. For every year in the future, there is an unlimited number of possible hazard scenarios and potential loss scenarios given the complexity of multiple, interacting perils and China’s expansive geography. Historical data can only describe a few of these scenarios, and the changes to affected crop area over time depicted in Figure 1 demonstrate the deficiencies of any approach based upon historical data.
The last 10 years of data (since the central government began subsidizing crop insurance) show a large range of outcomes with a factor of four between the years with the smallest and largest affected areas. The affected area in the past 10 years, however, is overall lower than that of the past 20 years. This suggests two possibilities: that the sample of historical data is significantly biased and not representative of the risk of loss, or that technological advancements have dramatically changed the risk of loss to agriculture in recent years. In either case, the utility of the historical period that spans the claims data is called into question.
Developing a Comprehensive View of Agricultural Risk in China
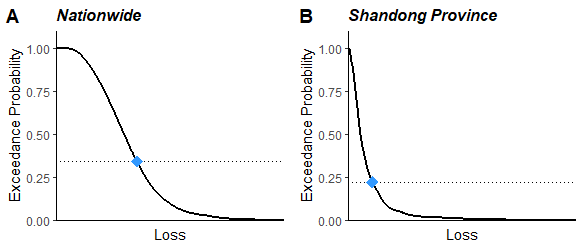
A full view of the risk can be developed from the exceedance probability (EP) curve, which expresses the relationship between a loss and the probability of a loss exceeding that value. A probabilistic approach to developing an EP curve starts with the creation of a stochastic catalog of 10,000 scenarios to account for various risk situations, where each year in the catalog characterizes the sequence of adverse events that occurs during a simulated year. The large number of modeled scenarios ensures that the probability distribution of loss is stable while capturing a wide range of loss scenarios.
The EP curve can be used to describe the probability of any level of loss, as well as to contextualize historical claims data. Historical year losses can be treated as points sampled from the loss probability distribution, and we can see the EP for specified historical years on the curve. Figure 2 shows where an insurer’s incurred crop losses in 2015 (blue dots) fall on EP curves derived from the AIR MPCI Model for China. The EP curves at the country level and for Shandong Province have significantly different shapes due to regional variability, and the corresponding 2015 crop losses had different exceedance probabilities as a result.
The AIR MPCI Model for China provides a full picture of crop risks, including tail risk, for both underwriters and risk managers to aid and support their decision-making by providing probabilistic loss expectations due to all major perils for all central government-subsidized crops—including drought, flood, frost/freeze, wind/hail, and heat. The model simulates a wide range of weather variable values while maintaining the important temporal and geographic patterns and relationships between variables. Risks can be analyzed and displayed at multiple geographical scales (nationwide, by province, or by county), by line of business, and by peril, to provide a robust view of risk for any actual or prospective China MPCI portfolio.
Learn more about agricultural risk in China