
The 2019 hail season in the U.S. garnered much attention from crop hail (re)insurers. The loss ratio of 98% (aggregated over the 42 contiguous states excluding New England states) was the highest since 2014, when it exceeded 100%. Total insured liability was about USD 35.3 billion and reported claims were nearly USD 990 million resulting in an industry loss cost of 2.8%.
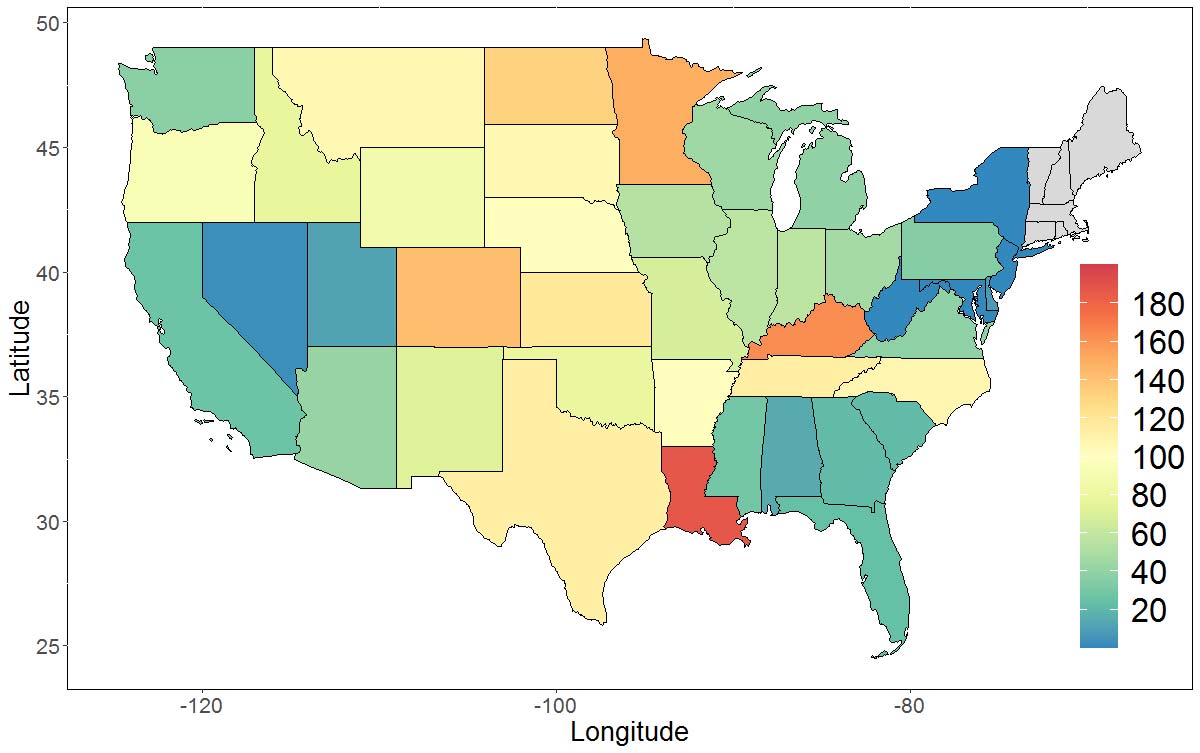
Collected premium across all crops in all states combined was just above USD 1 billion at an average rate of 2.87% of insured liability. In 13 states the loss ratio exceeded 100%. Among these were Arkansas, Kansas, Minnesota, Nebraska, North Dakota, and Texas, each with insured liability more than USD 1 billion (Figure 1). Louisiana, the state with the highest loss ratio (187%), had a modest total liability of about USD 187 million.
Losses by Coverage Type
Farmers in many states can choose from two broad categories of crop hail protection: traditional crop hail coverage and production plan endorsement coverage. Traditional crop hail insurance, which accounts for about 85% of total crop hail insurance liability, provides spot-loss coverage. Among the top 10 states in terms of last year’s insured liability, crop hail claims were more than collected premiums in four—Arkansas, Kansas, Minnesota, and Texas (Figure 2).
Average premium rates for crop hail insurance vary considerably across the states, which sometimes leads to a disconnect between loss cost and loss ratio. The loss cost in Minnesota and Texas, two states with similar levels of total crop hail liability in 2019, were 3.5% and 5.67%, respectively (Figure 3). Although the total loss and the resulting loss cost were larger in Texas, the lower average premium rate in Minnesota (2.88% against 5.06% in Texas) contributed to a higher loss ratio in Minnesota.
The second main option for farmers to protect themselves against hail losses is production plan, which works in tandem with the federal multi-peril crop insurance (MPCI) program. Under traditional crop hail insurance, claims are paid based on the percentage of the crop damaged by hail, but the production plan endorsement accounts for the total harvested production and adjusts the loss payment in coordination with the MPCI coverage. This insurance scheme, however, is not available in all U.S. states.
Farmers in 14 states insured their crops under production plan in 2019. Nebraska had by far the largest production plan premium and liability—more than the other 13 states combined (Figures 4 and 5). Total claims under the production plan scheme in Nebraska were close to USD 142 million, accounting for nearly 60% of the national total.
The 10% loss cost experienced in Nebraska, however, was dwarfed by the staggering loss cost numbers in Minnesota and Colorado. A total loss of USD 55 million in claims against USD 300 million in liability and about USD 23.3 million in collected premiums translated to 18.3% loss cost and 238% loss ratio for Minnesota, the state with the second largest production plan insured liability. Although Colorado experienced the highest loss cost at 24.3%, the 151% loss ratio was lower than that in Minnesota because of higher premium rates in Colorado.
An Increasing Trend in Crop Hail Losses?
Numerous studies have considered potential effects of climatic change on hailstorm patterns in the U.S. There is scientific consensus that severe thunderstorms with damaging hailstones are likely to be more frequent as a result of global warming . A major ingredient in the formation of severe thunderstorms is convective available potential energy (CAPE), which is a measure of the atmospheric fuel available for the storms. A warmer climate is expected to increase CAPE, favoring large hail events.
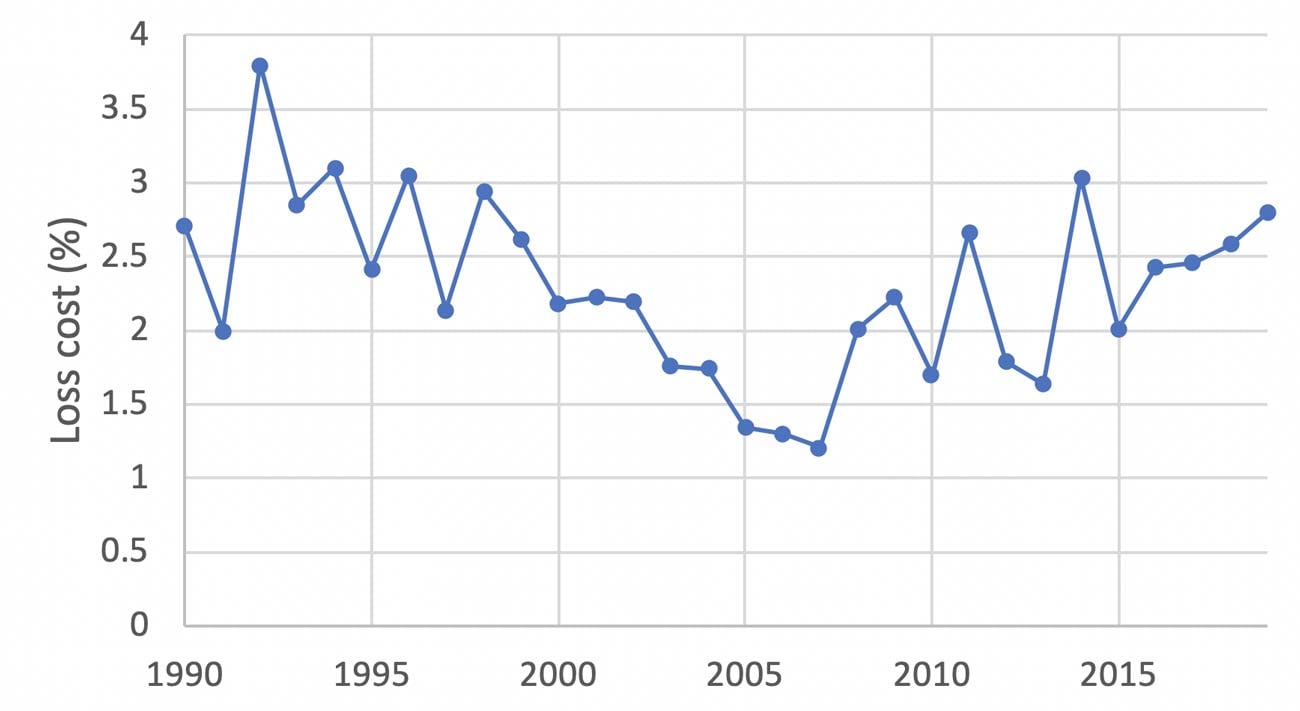
As the U.S. crop hail insurance industry experienced close to, or more than, 100% loss ratio in six of the last 10 years (Figure 6), the question of whether this is a consequence of climatic change is often asked. Claims data from the last 30 years does not provide a conclusive answer. The upward trajectory of industry-wide loss cost over the last decade or so was preceded by a decreasing trend observed from the early 1990s to late 2000s . Without evidence of a clear longer-term trend, the impact of climatic change on crop hail damage in the U.S. remains undetermined.
A Calmer 2020 Hail Season
In the wake of the August 2020 Midwestern derecho that flattened millions of acres of crops, especially in Iowa, (re)insurers are concerned about this year’s crop hail portfolios. As severe wind usually precedes any hail associated with a derecho, we think most claims associated with the derecho will fall under the MPCI policies.
Green snap and wind endorsements (optional crop hail endorsements that provide coverage against wind-induced damage such as the severing or breaking of cornstalks) are attached to some crop hail policies. These are likely to trigger payouts—which will add to the end-of-season crop hail loss total—but we estimate that less than 20% of total crop hail liability in Iowa includes additional endorsements attached (based on Iowa’s crop hail liability data for the last few years summarized by National Crop Insurance Services).
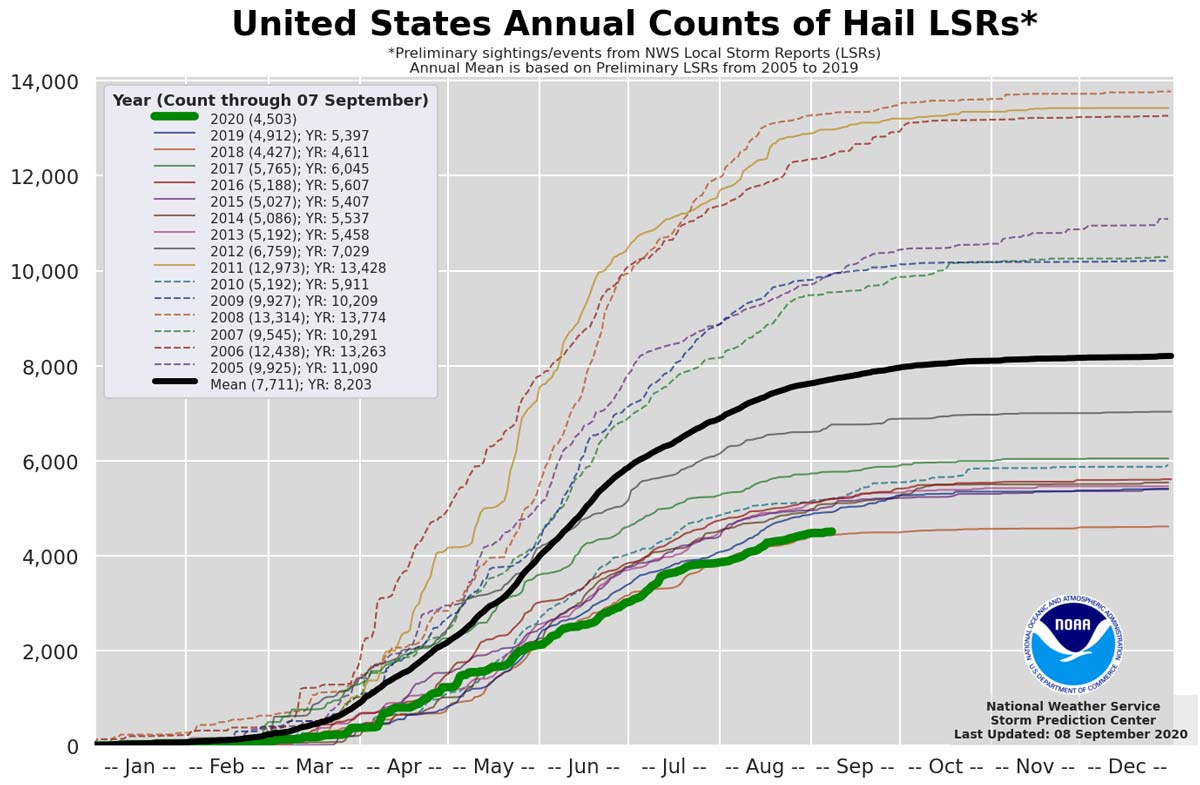
The National Weather Service’s Storm Prediction Center records the number of hailstorms with hailstones larger than 1 inch in diameter occurring each year across the U.S. (Figure 7). The comparison between this year’s storm count and data from the previous 15 years indicates that the 2020 hail season is on track to record the second lowest number of hail events since 2005. We do not, therefore, forecast an exceptional U.S. crop hail season in terms of insured losses, at least not yet.
Charts and analysis in this post have used data produced by National Crop Insurance Services™. NCIS has not reviewed the publication to determine whether the charts and analysis accurately reflect NCIS research and data. Any analytical errors are solely the responsibility of the author.
Maximize profit potential and make better decisions with AIR agricultural risk models and services