
One year ago, on September 1, 2019, Hurricane Dorian made landfall in the Bahamas as a Category 5 storm, wreaking havoc and causing billions of dollars of losses. Hurricane Dorian became the strongest hurricane to hit the Bahamas since records began, causing devastation on Great Abaco and Grand Bahama islands. While the damage done by Dorian was unprecedented, you don’t have to get caught off guard by the next catastrophic hurricane.
AIR's Catalog Viewer is a tool that can provide you with a host of analytical capabilities in real time using our stochastic catalogs, real-time data feeds, and storm-intensity footprints. Using Catalog Viewer for real-time risk evaluation is simple and accessible instantly anywhere, enabling you to find similar stochastic events (SSEs) that are applicable to your region of interest. Let’s use Dorian as an example.
Access the Latest Data
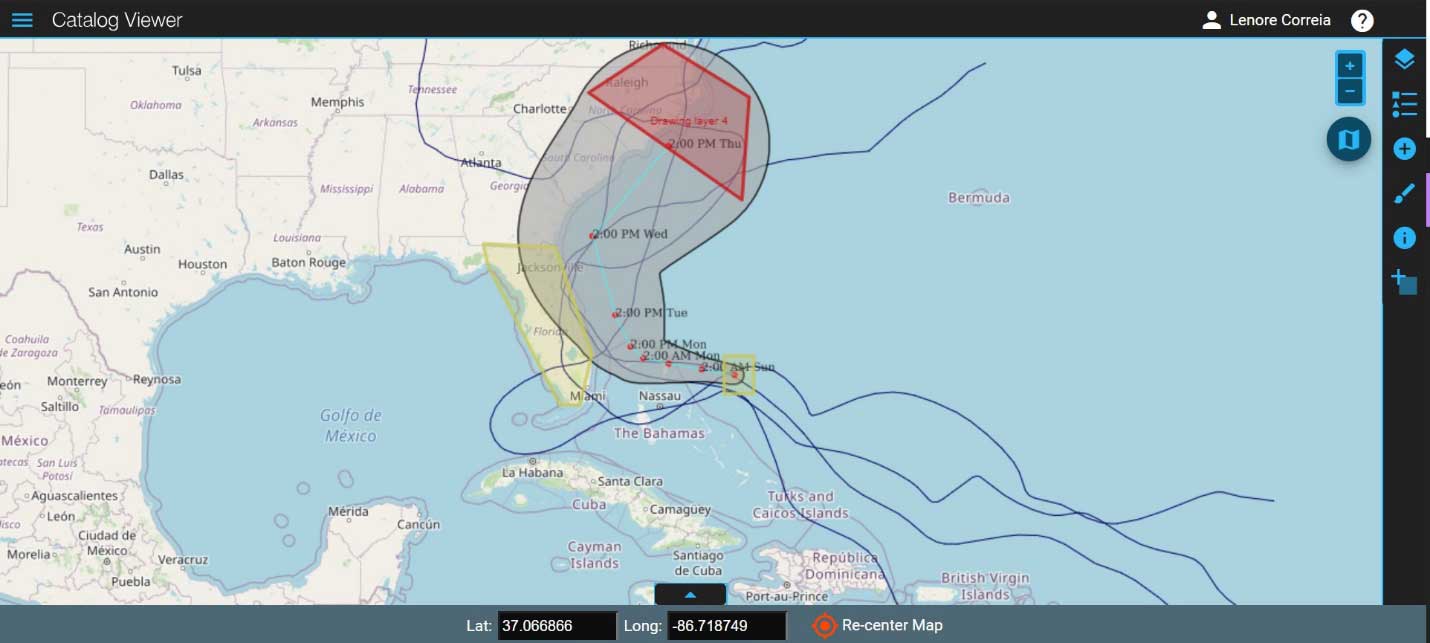
Within just 24 hours between August 30 and 31, the track of Hurricane Dorian changed drastically. It was predicted to track more north than northwest, resulting in a much different risk for Florida. Every 6 hours, Catalog Viewer ingests the new hurricane advisories published by the National Hurricane Center (NHC), giving you access to the latest data on a storm. Overlaid with NHC’s latest cone of uncertainty, Catalog Viewer’s spatial filters can help you find a new set of SSEs that show how the risk has changed from an adjusted track, such as Hurricane Dorian’s shown in Figure 1.
Hone Your View of Potential Hurricane Risk
Hurricane Dorian came to a near standstill over Grand Bahama Island late September 1 with sustained winds nearing 155 knots. To quickly find SSEs for storms such as Hurricane Dorian, use Catalog Viewer spatial filters to filter for any storms that originate over Grand Bahama Island with a forward speed of more than 5 to 10 mph and sustained wind speeds near 155 knots. You can also filter SSEs based on central pressure, radius, and wind speed. This specificity can give you a better view of your potential risk, while filtering out the rest.
View More of Your Risk
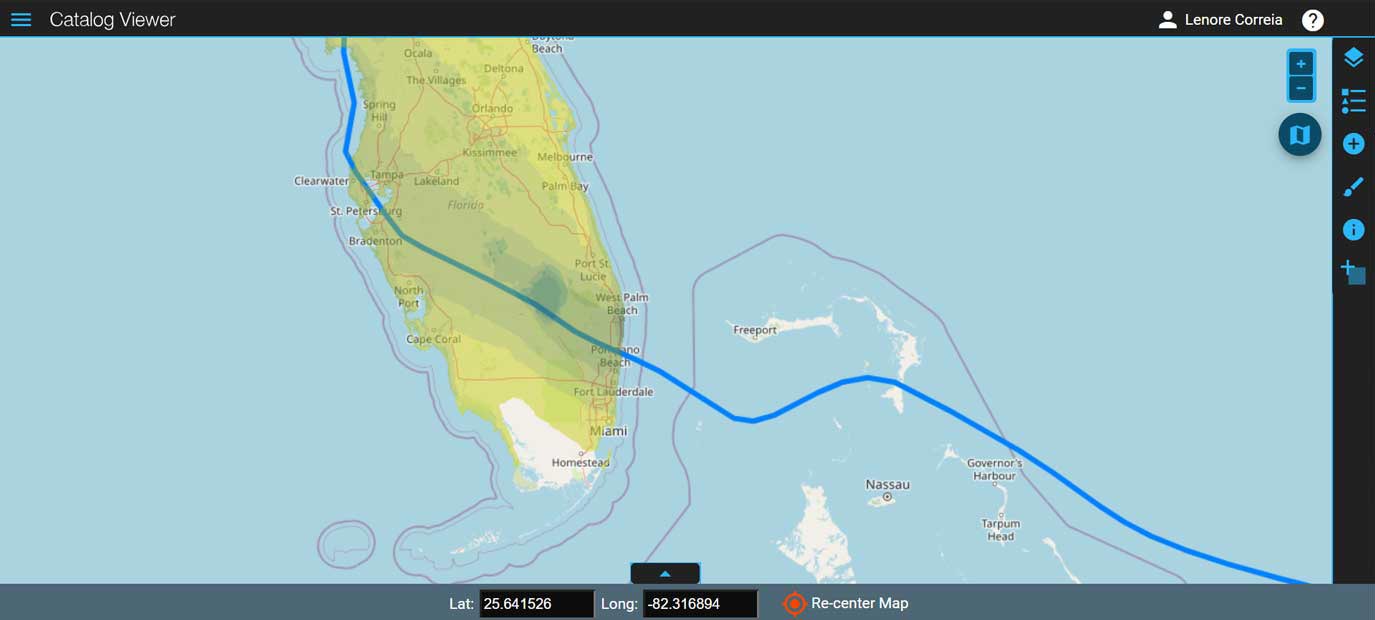
Hurricane Dorian’s maximum sustained winds reached 185 mph with hurricane-strength winds (≥74 mph) extending up to 45 miles from the eye of the storm, and tropical storm–force winds (≥39 mph) extending up to 140 miles. To better visualize the extent of a potential wind field, you can select any SSE in our 10K U.S. hurricane catalog and view its wind intensity footprint (Figure 2). Storm surge intensity footprints and hourly point data for each SSE are also available in Catalog Viewer and can provide a more accurate view of your risk. Then, once you have selected a handful of SSEs to estimate a range of possible outcomes, you can export these events into Touchstone® to evaluate your potential losses.
Be prepared for the worst this hurricane season with Catalog Viewer. Take hurricane risk management into your own hands: Find the SSEs that matter the most instantly with Catalog Viewer to help you stay one step ahead of your risk.
Learn more about Catalog Viewer’s real-time analytics