
In an 1856 paper, amateur scientist Eunice Newton Foote first demonstrated the impact of CO2 on atmospheric warming; her paper had to be read by a male colleague at the American Association for the Advancement of Science, as she was barred from presenting her own work. Quantitative estimates of the impact of CO2 on temperature have been made ever since.
In 1896 Svante Arrhenius, one of the founders of the science of physical chemistry and future Nobel Prize winner, estimated a 5-6°C increase from a doubling of CO2, without satellites, computers, models, or a lot of data. About 80 years later in 1979, MIT professor of meteorology Jule Charney and co-authors estimated that, all else held constant, a doubling of carbon dioxide (CO2) would warm the Earth by 3˚C, plus or minus 1.5˚C. Their paper, which has come to be known simply as the “Charney Report,” was among the earliest scientific assessments of global warming, and their 1.5˚C to 4.5˚C estimate of climate sensitivity (e.g., how much Earth’s temperature will change from a doubling of CO2) would remain largely unchanged for 40 years.
The Intergovernmental Panel on Climate Change (IPCC) adopted this range in its First Assessment Report issued in 1990 and formalized it to represent the "likely" outcome, meaning there is a 66% or greater probability of occurrence. With the exception of a slight narrowing of the range in their Fourth Assessment Report in 2007 (2.0˚C to 4.5˚C), justified by a "better understanding" of feedbacks of water vapor, the IPCC has used Charney’s range in all of their reports, including the Fifth Assessment Report published in 2014.
Recently, however, the range just became a little tighter. Last month, a group of 25 multi-disciplinary scientists working under the auspices of the World Climate Research Programme published findings from a 4-year-long effort to reduce the uncertainty in this important metric. The results support a likely range of between 2.6˚C and 3.9˚C.
A Three-Pronged Research Effort: Historical, Paleo, and Processes
The authors of last month’s paper followed three independent lines of research, the first of which was a re-examination of recorded temperature data since the industrial revolution. They also had at their disposal an additional four decades of data since Charney’s initial estimate, when CO2 concentrations were about 339 parts per million (as measured in May 1979, at the Mauna Loa Observatory). In May 2020 concentrations had risen to 417 ppm, a level not reached for some 3 million years.
The second line of research involved paleoclimate records. Of the many cooling and warming periods studied, the authors found that the most useful were the mid-Pliocene Warm Period of 3-3.3 million years ago (when surface temperatures and sea levels were significantly higher than today’s) and the Las Glacial Maximum cold period of roughly 20,000 years ago. Estimates of climate properties and their changes during these periods were obtained from various sources, including greenhouse gas concentrations in the air bubbles within ice cores, as well as proxies such as the fossil records, global sea-level and ice-sheet reconstructions, and modeling—given the vast uncertainties inherent in estimating climatic changes tens of thousands and even millions of years ago.
The third line of investigation was into climate feedbacks that can either amplify the warming (positive) or constrain it (negative). Specifically, the authors examined physical processes that might set constraints (upper and lower bounds) on climate sensitivity—processes that influence the balance between incoming energy from the sun, what gets reflected or radiated back to space, and what is ultimately absorbed to warm the planet. These processes include changes in cloud formation, water vapor, and surface albedo (Earth’s reflectivity, as from ice and snow), among others.
Some climate feedbacks are well understood. For example, as anthropogenic greenhouse gas concentrations rise, so do surface temperatures. As temperatures rise, evaporation rates increase, which increases water vapor concentrations in the atmosphere. Increased water vapor, itself a major greenhouse gas (albeit not anthropogenic) also traps energy and further warms the planet—a positive feedback. The albedo effect is another positive feedback. Ice and snow reflect solar energy and thus act to cool the earth. As CO2 warms the atmosphere, glaciers and ice sheets melt, shrinking the area they cover. When that area is replaced by darker land or water, Earth's reflectivity decreases, and more solar energy is absorbed, warming the atmosphere further.
Some climate feedbacks are not well understood. Because the effect of cloud formation is not straightforward, it became a focus of the team. Clouds can act as either a positive or a negative feedback depending on their type and location. Higher, thinner cirrus clouds trap more heat, while lower, thicker cumulus clouds reflect more sunlight. Recent high-resolution cloud simulation models suggest that higher temperatures tend to prevent clouds from thickening (thus reducing their reflectivity) by introducing dry air from above. Higher temperatures can also reduce turbulence, which drives cloud formation. While there is still uncertainty as to whether cloud feedback will ultimately be positive or negative, observations from satellites and ships support the finding that the net feedback is positive.
Particularly important for this study is the independence of the three lines of research, as well as sources that extended beyond the usual global climate models to include observation data from “recent” warming and preserved records in ice cores, fossils, and other paleoclimatic sources. The result is increased confidence in climate projections that will be incorporated into the next IPCC climate assessment due out in 2021 or 2022.
Good News and Bad News
The newly estimated range for climate sensitivity—2.6˚C to 3.9˚C—represents the 66% confidence interval, or “likely outcome,” as defined by IPCC. There is some good news and some bad news to be had from these findings. The bad news is that the lower end of Charney’s estimate is now all but ruled out. The Paris Agreement, which was reached in 2015, set a goal of keeping the increase in global surface temperatures to well below 2°C and to pursue efforts to limit the increase to 1.5°C. The authors of last month’s paper found that there is less than a 5% chance of staying below 2°C.
The good news, if there is any to be found, is that the high end of the initial range is now deemed less likely to occur, although not impossible. The authors calculate a 90% confidence interval ranging from 2.3°C to 4.7°C. There is a 6-18% chance of exceeding 4.5°C, and there remains a slight chance of warming above 5°C.
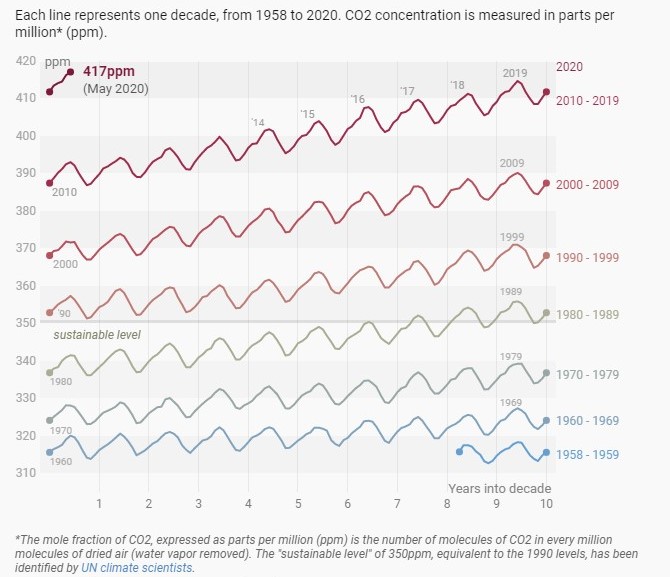
Remember that the definition of climate sensitivity is the warming due to a doubling of CO2 concentrations in the atmosphere. Pre-industrial levels have been estimated at 280 ppm; they are about 415-417 ppm today and, despite significant reductions in coal-burning power plants, the rate of increase continues to rise as evidenced by the increasing slope of the data series in Figure 1. (The current reduction due to the COVID-19 pandemic is likely to be short-lived.) On the other hand, there is some reason to believe that total greenhouse gas emissions may not achieve the levels contemplated by the most pessimistic of the IPCC’s Representative Concentration Pathways. Let’s hope so.
Learn about AIR’s Climate Change Practice