
Dams are inherently hazardous structures and their failure can lead to disastrous consequences. In the United States, May 31 is designated National Dam Safety Awareness Day to highlight ways of preventing catastrophic dam failures and reducing their impacts. A couple of weeks before it was marked in 2020, however, the dramatic failure of two Michigan dams dating from the 1920s publicized the growing risk even more effectively. With more than 10,000 people evacuated in advance of the event in Michigan no injuries or loss of life was reported, but flood damage has been catastrophic.
Following the problems experienced in northern California in 2017, AIR modeled what would have happened if the Oroville Dam’s auxiliary spillway had failed catastrophically. In this blog AIR provides two views of flood extents and depths along the Tittabawassee River in Michigan below the second dam. The first scenario uses the actual event as its basis and the second (Figure 1) presents a realization of what would have happened if there been a cascading failure with both dams failing rapidly.
The Dam Failures
Precipitation from a cutoff low (a slow-moving low-pressure system) caused significant flooding in parts of the U.S. Midwest and Southeast. On Sunday May 17 and Monday May 18, Midland, Bay, and Saginaw counties in Michigan received 3 to 4 inches of rainfall.
The heavy precipitation caused some erosion on the downstream side of the Smallwood Dam on the Tittabawassee River. A few miles downstream, Wixom Lake started overflowing through the spillway of the Edenville Dam into the river and on to the much smaller Sanford Lake 10 miles downstream. Early on the morning of Tuesday May 19, six miles downstream near downtown Midland, the river was already 1.5 feet above its flood level of 24 feet. By 6:50 a.m. that day it was clear that the Edenville Dam could not contain the flow; residents downstream from the dam were advised to evacuate.
On the evening of May 19, at 5:46, a section of the eastern side of the Edenville Dam collapsed, releasing a greater torrent downstream. Much of Wixom Lake drained into the river, flowed on into Sanford Lake, and overwhelmed the Sanford Dam. The water flowed over and around the concrete portion of the Sanford Dam slowly creating a massive breach in the earthen embankment and the lake drained. By Wednesday evening the Tittabawassee River had reportedly crested at about 35 feet in Midland, well above the 1986 record of 33.89 feet at that location.
Waterfront homes along the Tittabawassee “were impaled or ripped in half by others” according to a report from MLive and “huge, uprooted trees lay on what remained of washed-out bridges.” Parts of Midland were inundated with up to 9 feet of water—more than in the Great Flood of 1986, which the local newspaper called at that time "the worst natural disaster in the state's modern history."
Modeling the Flood Extents and Depths
Both scenarios were modeled using AIR’s in-house Graphics Processing Unit (GPU)-based 2D Shallow Water Wave model. The modeled domain includes downstream of the Sanford Dam to Midland, Michigan. The latest USGS digital elevation model (DEM) was used, which includes 1-meter LiDAR elevations disaggregated to the model resolution of 10 meters for most of the model domain. Input hydrographs were used as boundary conditions immediately downstream of the Sanford Dam, upstream on the Salt River, upstream on the Chippewa River, and upstream on the Pine River to properly account for the interactions where the different rivers converge.
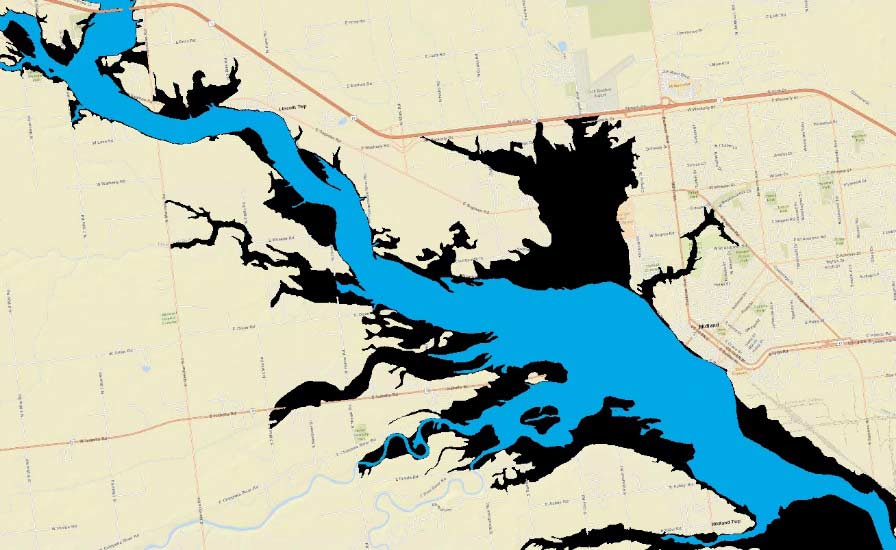
The USACE HEC-HMS model was used to create these input hydrographs based on AIR’s best estimates of precipitation distribution, watershed characteristics, reservoir storage relationships, and dam and spillway parameters. The breach parameters for the Edenville Dam were estimated based on descriptions and images of the event. Model parameters were adjusted to match the flow hydrograph at the USGS gage at Midland, Michigan, as closely as possible. The simulation was run for 81 hours starting on May 18. The 2D model was validated using the Landsat satellite imagery of the event (Figure 3) and the peak water level at the Midland gage.
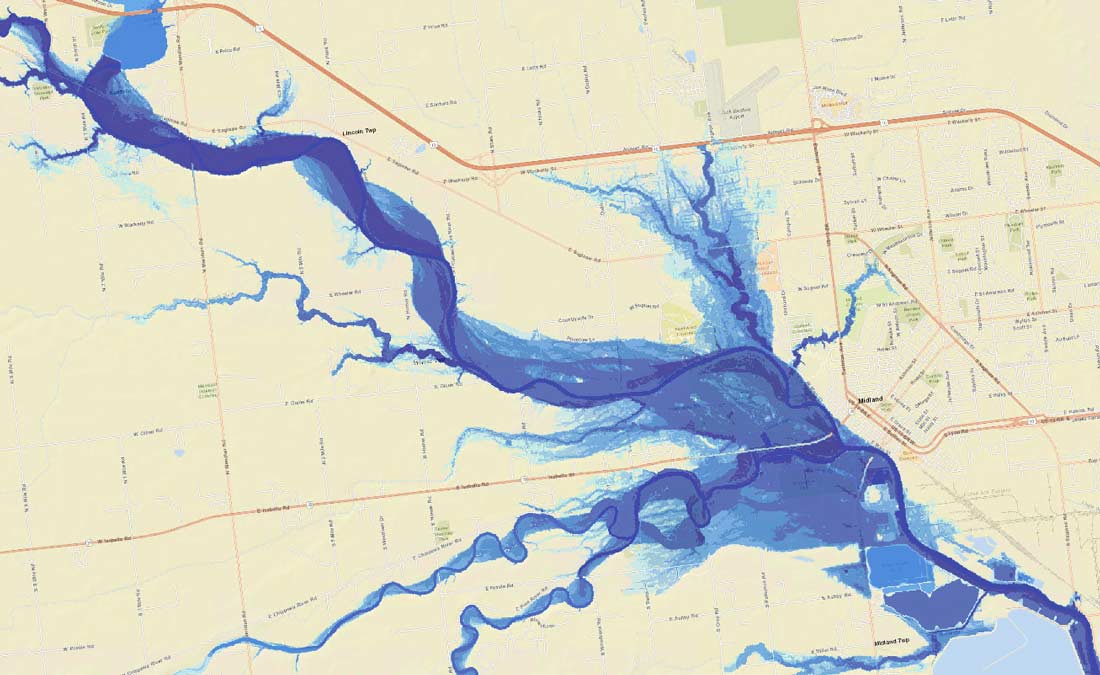
Scenario 1: The Actual Event
The modeled flood extents for the actual event are shown in Figure 2. Extents show good agreement with the Landsat imagery in Figure 3 and the peak water level is within 1 foot of observations at the gage.
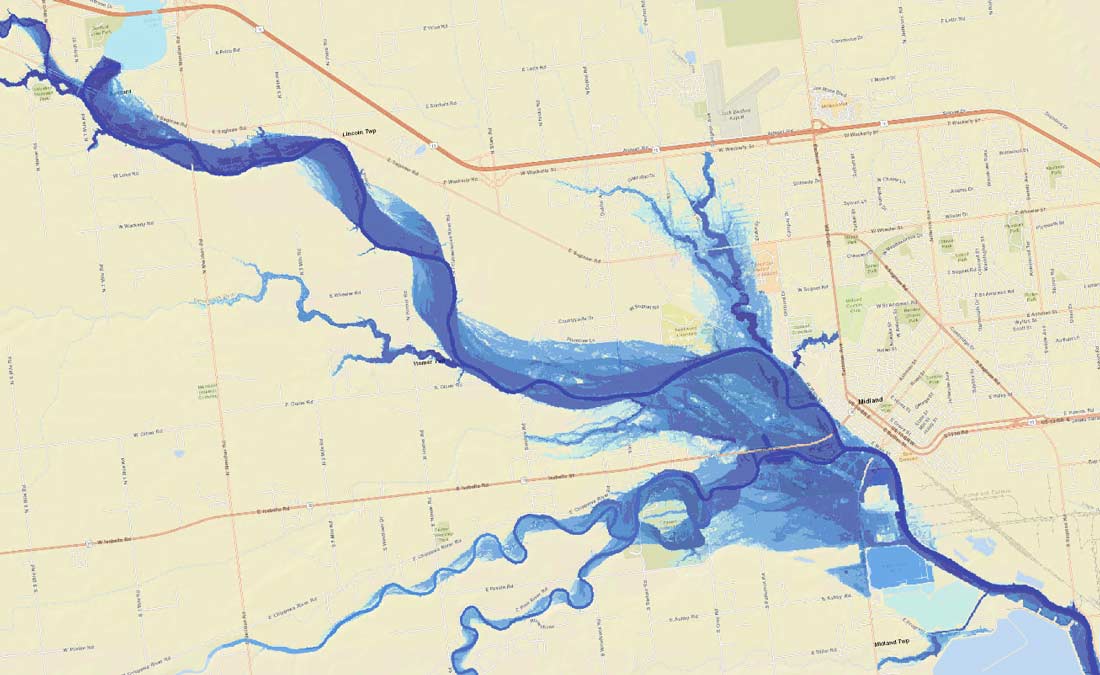

Scenario 2: A Cascading Failure of Both Dams
The Sanford Dam Breach scenario assumes that the 36-foot high Sanford Dam breached catastrophically when the reservoir surface reached its maximum elevation, which was modeled to be 632 feet above the North American Vertical Datum of 1988 (NAVD 88) at around 10:00 a.m. on May 20. Breach parameters including breach width and breach development time were calculated using common equations found in the literature. The modeled breach would result in a flood wave with a peak flow of around 85,000 cubic feet per second. The maximum flood extent is shown in Figure 4.
The extents shown in Figure 4 are not as large as the worst-case flood inundation from the Emergency Action Plan shown in Figure 5. The extents shown in Figure 4 are still significantly larger than the fair-weather failure scenario (failure during dry conditions). The flood stage at the USGS Midland gage reaches around 37 feet. While downtown Midland is largely spared in this breach scenario, the neighborhoods along Sturgeon Creek north of North Saginaw Road experience depths of 2 to 6 feet. The village of Sanford has a modeled depth of around 14 feet along West Saginaw Road. The animation provided in Figure 1 is based on hourly snapshots of the flood wave from the breach of the Sanford Dam starting at the time of breach.
From 2005 to 2013 some 173 dam failures were reported by state dam safety programs in the U.S. along with 587 incidents that might have led to failure. The 2018 National Inventory of Dams records 91,457 dams in the U.S. Of these, 15,500 were deemed in 2016 to be high-hazard potential dams—a designation that reflects their potential for doing damage downstream should they fail. The number of high-hazard potential dams is growing partly because maintenance deficiencies accumulate as infrastructure ages but principally because more development is occurring downstream. The website of the Association of State Dam Safety Officials notes that by 2025, seven out of 19 dams in the U.S. will be more than 50 years old and that, “without the needed upgrades and rehabilitation, these dams cannot be expected to withstand current flood and earthquake predictions.”
Review AIR’s scenario of a catastrophic failure of the auxiliary spillway for the Oroville dam