It is often noted that earthquakes don’t kill people, buildings do. That is why appropriate and effectively enforced building codes—and the science that informs their development—are so important. The hazard maps used to develop building codes are also frequently used to inform the hazard component of catastrophe models.
Until recently, the basis for the Australian building code (AS1170-4) was the National Seismic Hazard Map of Australia created in 1991 following the first Australian probabilistic hazard assessment in 1990. Australia is an intraplate region, located in the middle of a tectonic plate, not on an active boundary like the “Ring of Fire,” but the view of hazard underlying the Australian building code suggested a higher level of hazard than other stable continental regions.
That view has now changed. Through the NSHA18 project, Geoscience Australia (GA) has developed an updated National Seismic Hazard Map for a revised building code (AS1170.4-2018). It challenges established conceptions of Australia’s seismic hazard and generally decreases seismic hazard factors significantly.
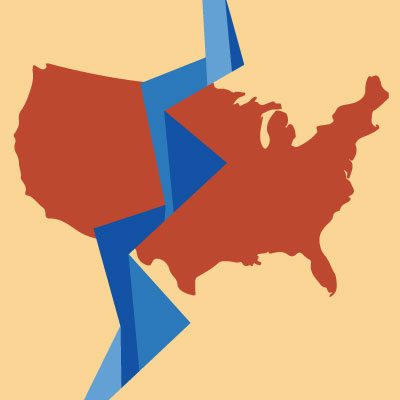
Australia is considered a stable continental region, tectonically similar to central and eastern North America. While historical seismicity in the region has been relatively low, larger magnitude earthquakes do occur in Australia. When such earthquakes occur near large cities—the 1989 local magnitude (ML)5.4 Newcastle earthquake, for example—they can be catastrophic.
The current Australia building code ranks most major cities in Australia, such as Perth, Sydney, Adelaide, and Melbourne, in the same category as St. Louis, Missouri, in the U.S., or Montreal, Quebec, in Canada. St. Louis and Montreal are both cities located near—not within—special seismic zones in stable continental environments where large magnitude earthquakes have occurred in recent history. Upon the revision of Australian seismic hazard this year (Figure 1)—with the exception of the capital city of Canberra—hazard at the 500-year return period in major Australia cities has significantly reduced. For example, the 500-year return period peak ground acceleration (PGA) hazard in Perth, Sydney, and Adelaide are now below the hazard level expected for many low seismic risk cities in the eastern U.S. such as New York and Boston.
The 2018 National Seismic Hazard Map of Australia is shown in Figure 1. Apart from the above-mentioned hazard reductions in most major cities such as Perth, Sydney, and Adelaide, in comparison with 2012 hazard the 2018 hazard is reduced in the areas of historical earthquake clusters or so-called “hot spots.”
The NSHA18 update yields many enhancements when compared to Australia’s previous seismic hazard maps, including:
- Consistent expression of earthquake magnitudes in terms of moment magnitude, or MW
- Inclusion of epistemic uncertainty through the use of multiple source models
- Inclusion of a national fault-source model
- Use of improved ground motion prediction models and adoption of a wide set of ground motion prediction equations to account for epistemic uncertainties.
- Calculation in a probabilistic framework using the Global Earthquake Model’s Open Quake Engine, which improves the transparency of the model and allows more detailed information to be extracted from the model results
The main cause for hazard reduction can be attributed to two primary factors—the revision of historical earthquake catalog data and the change in ground motion model. Historical catalog revisions include the modification of Australia’s local magnitudes and the conversion of local magnitudes to moment magnitudes. The modification of local magnitudes has the more significant impact as it substantially reduced the overall rate of seismicity in the country (as illustrated by the Eastern Australia historical catalog in Figure 2). The impact of magnitude conversion to moment magnitude is relatively small but not negligible.
The ground motion model change also caused significant hazard reduction in the 2012 map. In the 2018 map, the ground motion model has been further updated to include more ground motion attenuation equations developed based on data in other regions of the world. This was done to better account for the epistemic uncertainties, as the availability of ground motion data in Australia is very limited.
The 2012 hazard map considered three types of source models, all developed by Geoscience Australia. The NSHA18 included 20 seismic source models to account for uncertainties in the seismic sources. The impact of the chosen source models can be significant, as each model can lead to different hazard. Figure 3 shows the hazard result for Perth obtained from different seismic source models. For example, at the 10% probability of being exceeded in 50 years (i.e., about 500-year return period), the hazard varies by a factor of three.
It should be noted that hazard change at certain return periods does not directly translate into loss change in a risk model, as hazard at any return period only reflects certain characteristics of the hazard model. A seismic risk model is affected by all types of earthquake and site conditions at a location can significantly affect the seismic intensity and hazard. Therefore, caution must used in interpreting or interpolating the hazard change results from the NSHA18 to any risk analysis.
The findings of the NSHA18 project are so significant that they prompted AIR to trigger an update of our Earthquake Model for Australia. The update will be released as soon as practically possible. In the meantime, as AIR’s scientific review of NSHA18 progresses, further documents that will help users quantify the importance of this change will be provided.