Australia experiences tropical cyclones, severe thunderstorms, bushfires, earthquakes, floods, and other perils, and the damage caused by them is increasing every year. According to the Insurance Council of Australia (ICA), economic losses from natural catastrophes surpassed AUD 1.5 billion in 2015, and a 2006 study by the Bureau of Transport Economics showed that weather-related events caused significant insured losses from 1966–2005.
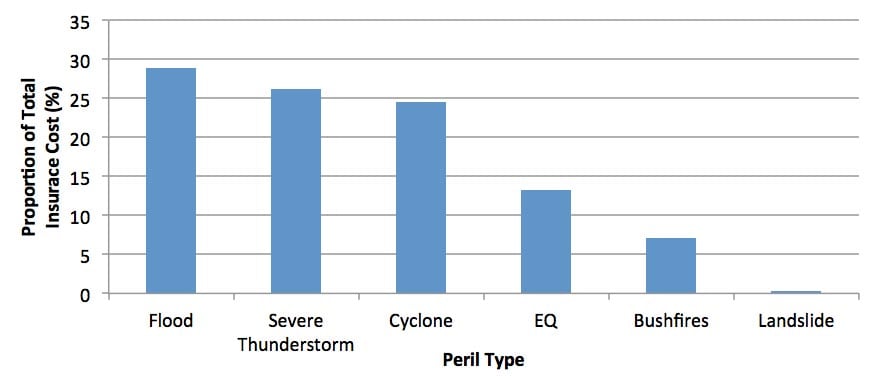
A breakdown of Australia’s biggest natural disasters by peril shows that atmospheric perils are the most damaging (Figure 1). While flood is the top loss-causing peril overall, severe thunderstorms are the largest loss contributor among wind perils.
Recently, the ICA published the 10 largest catastrophe events in Australian history (Table 1). The Sydney hailstorm of 1999 ranked first, highlighting the importance of understanding the underlying severe thunderstorm risk in all regions of Australia. In addition to the large proportion of hail claims, the high frequency of severe winds (tornadic and straight-line) calls attention to the relevance of an approach that captures all three sub-perils to accurately quantify the risk imposed by severe thunderstorms.
| Rank | Event | Year | Location | State/Territory | Original Loss (AUD Million) | Normalized Loss Estimate (AUD Million)* |
|---|---|---|---|---|---|---|
| *Trended to 2015 dollars. | ||||||
| 1 | Hailstorm | 1999 | Sydney | NSW | 1,700 | 4,854 |
| 2 | Tropical Cyclone Tracy | 1974 | Darwin | NT | 200 | 4,622 |
| 3 | Earthquake | 1989 | Newcastle | NSW | 862 | 3,661 |
| 4 | Flood | 1974 | Brisbane | QLD | 68 | 2,989 |
| 5 | Flood | 2010 | Multiple | QLD | 2,380 | 2,689 |
| 6 | Hailstorm | 1985 | Brisbane | QLD | 180 | 2,331 |
| 7 | Ash Wednesday Bushfires | 1983 | Multiple | VIC/SA | 176 | 2,029 |
| 8 | Severe Storm | 2007 | Multiple | NSW | 1,480 | 1,968 |
| 9 | Tropical Cyclone Madge | 1973 | Multiple | QLD/NT/WA | 30 | 1,686 |
| 10 | Tropical Cyclone Yasi | 2011 | Multiple | QLD | 1,300 | 1,528 |
Risk
Based on the past 50 years of historical industry loss data, the average annual loss (AAL) from severe thunderstorms is AUD 600 million. Catastrophe loss potential is increasing as property replacement values rise in the densely populated cities of Sydney, Brisbane, Perth, Melbourne, Canberra, and Adelaide. Furthermore, the number of insurable exposures continues to grow as development expands into previously unpopulated areas and hazard-prone regions.
The regional breakdown of AAL from historical data shows that there is eminent severe thunderstorm risk across all states and territories in Australia, although the magnitude of insured losses varies (Figure 2). Collecting complete and accurate exposure data from all regions will enable insurers to reduce uncertainty in their risk analyses and own their risk.
Vulnerability
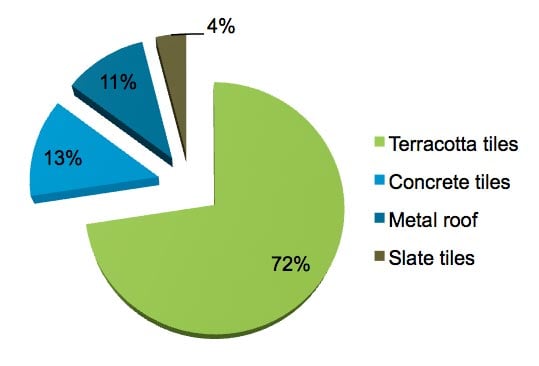
Damage reports from significant severe thunderstorm events indicate that the quality of construction materials and practices has a substantial impact on the vulnerability of structures. For example, after the 1999 Sydney hailstorm, the majority of houses affected by this event experienced severe roof damage. A survey of residential building stock in the Sydney area by the Australia Bureau of Statistics (ABS) showed that tiles are the most common roof cover (Figure 3). Studies found that aging and deterioration of tile roofs, which degrade their capacities to resist damage from hail and severe wind, were main contributors to this event being the costliest storm in Australian history.
The type of wall siding and opening protection also play a critical role in vulnerability. A comprehensive understanding of the evolution of building codes and their enforcement; local construction practices and materials; primary and secondary risk characteristics; and year built allows insurers to better differentiate exposure vulnerability.
Managing the Risk
Given the frequent damage from severe thunderstorms throughout Australia and the scale of resulting insured losses, it is important to have a comprehensive understanding of the underlying risk and the right tools to manage it. The new AIR Severe Thunderstorm Model for Australia is a robust risk management tool that has been carefully validated against historical losses to accurately capture this risk. It takes into account the interdependency of the three sub-perils (hail, tornado, and straight-line wind) and accounts for an exhaustive list of Australia-specific construction and occupancy classes across all states and territories.