Each year in the late spring, many await the release of hurricane season forecasts. A number of government agencies, academic institutions, and private firms forecast the numbers of tropical cyclones that are expected to form during the season, which traditionally runs from June 1 to November 30. The predictions are typically for the total numbers of named storms (including tropical storms with maximum wind speeds greater than 39 mph), hurricanes (maximum wind speeds greater than 74 mph), and major hurricanes (maximum wind speeds greater than 110 mph).
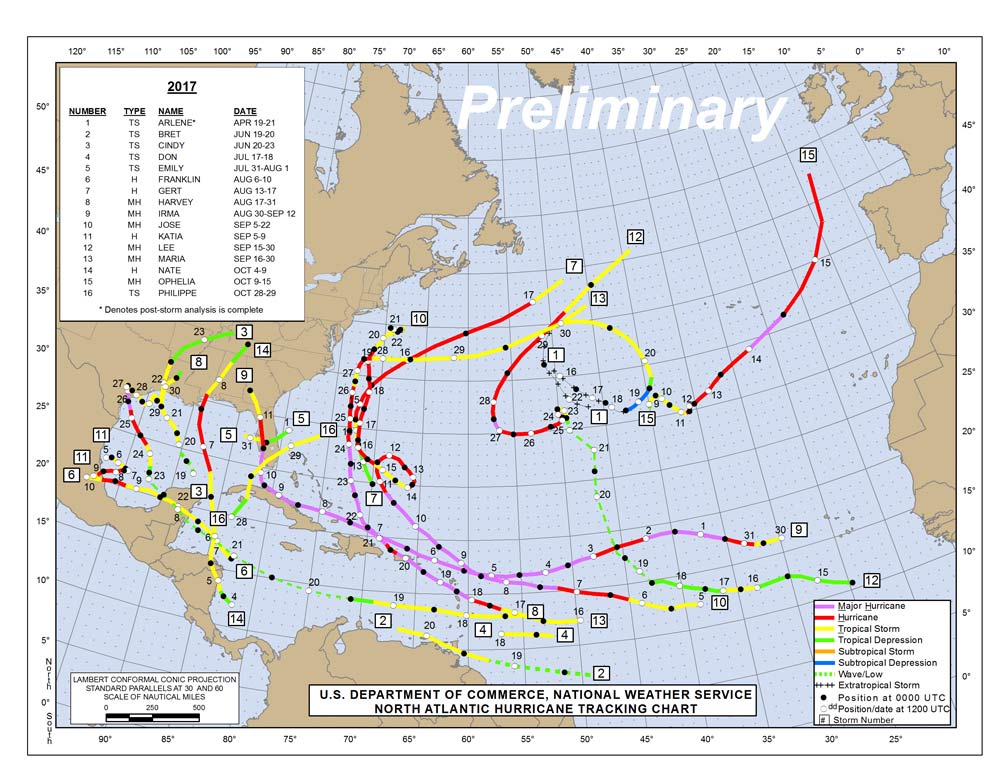
In a typical year, around 12 named storms, 6 hurricanes, and 3 major hurricanes (Category 3 and higher) form in the North Atlantic basin; this includes the Caribbean Sea and Gulf of Mexico. As all too many are aware, the 2017 season has been anything but typical, as we have seen 16 named storms, 10 hurricanes, and 6 major hurricanes develop, with devastating results.
Quantity Isn’t Everything
While the predicted numbers of storms can give a general idea about the potential for destruction in a season, there is another quantity that is forecast that actually conveys the seasonal destructive potential better and is contained in a single value: Accumulated Cyclone Energy, or ACE. The ACE is defined mathematically as:
In this equation vmax is the cyclone’s intensity (maximum sustained wind speed) given in knots (1 knot = 1.15 mph). Since kinetic energy is proportional to the square of wind speed, this quantity has been given the name ACE, and the “accumulation” of energy is indicated by summation over each 6-hour advisory. So, ACE will become larger for long-lived tropical cyclones, and very intense storms will accumulate energy more rapidly.
Since ACE is a summed quantity, a single value can be used to characterize tropical cyclone activity over an entire season. In fact, the seasonal forecast by Colorado State University, which is perhaps the best known, actually predicts seasonal ACE; the numbers of storms in each of the three categories expected to develop are more of a byproduct of the seasonal ACE prediction.
Record Breakers
Using a climatological baseline of the years 1950–2016, the average annual ACE in the North Atlantic basin is about 101 units, with a standard deviation of 56. Roughly half of the ACE (i.e., around 50 units) occurs before the peak of the season around September 11 and the remaining half afterward. ACE typically builds up most rapidly in a roughly one-month period between the end of August and the end of September, which is also when most major hurricanes tend to occur. The year with the highest ACE on record is 1933, with a value of around 258 units, and the second-highest ACE occurred much more recently in 2005, with a value of 250 units. The year 1914 had the lowest ACE on record, with 3 units, and only one tropical cyclone is known to have formed that year. In the modern record, 1983 was the fourth “quietest” year, at 17 units and four named storms.
For individual storms, the modern-day ACE record holder is Hurricane Ivan in 2004, which lasted for 23 days and spent a significant amount of time as a Category 4 or 5 storm as it traversed the Caribbean Sea and Gulf of Mexico. After making landfall in the Florida Panhandle and looping around for several more days before it dissipated, Ivan accumulated 70 units all on its own. This is within 1 standard deviation of an entire season’s average ACE!
The strongest Atlantic hurricane on record in terms of maximum wind speed was Allen in 1980, which sits in eighth place in terms of ACE at 52 units, officially. Considering all 25 storms on record with an ACE greater than 40, only one was never a major hurricane during its lifetime: Ginger in 1971 lasted a whopping 28 days and is the second longest–lived Atlantic hurricane on record!
So, What About This Year?
This brings us to 2017. Looking at the modern record back to 1950, the only years in which two storms developed with ACE values greater than 40 units are 1966, 2003, and 2004. And until 2017, no season has ever had more than two such storms develop. In 2017, however, hurricanes Irma, Maria, and Jose had ACE values of 67, 45, and 42 units, respectively, which is unprecedented. Hurricane Irma is particularly noteworthy, for it is now second only to Ivan in ACE. Irma has such a large value due to the amount of time it spent as a Category 5 storm (a record 3 days and 3 hours), and the 37 consecutive hours at the extreme intensity of 185 mph—the longest recorded anywhere on the planet!
While attention was focused on Irma as it made landfall as a Category 4 hurricane in Florida, Jose became a Category 4 storm and threatened the same areas of the Lesser Antilles that had been devastated by Irma just a few days earlier. And not to be outdone, Hurricane Maria became a Category 5 in a similar location, destroying Caribbean islands that Irma hadn’t a couple of weeks before.
So where does 2017 stand now? Through Maria we were up to around 203 ACE units—which by itself would be good for ninth-highest on record—and September wasn’t even over yet. Since then, there have been four more named storms in the Atlantic (Nate, Ophelia, Phillipe, and Rina), bringing the ACE to 226, which is currently seventh-highest on record. Now that we are into November, the season is winding down and, climatologically speaking, we are around 94% of the way to the finish line. If we see a 6% increase in ACE during the remainder of the season, we would close out 2017 with an ACE of 237.