In 1949, when Popular Mechanics predicted that computers of the future might have only 1,000 vacuum tubes and weigh a mere 1.5 tons, no one could have imagined the awesome power of today's computing technology. AIR's Touchstone® leverages recent hardware and software advancements to provide new and valuable insights driven by high-resolution geospatial data sets that incorporate hazard parameters, simulated model data, and financial terms (i.e., policy conditions).
And it is thanks to these technological advances that Touchstone can accurately calculate and store modeled risk variables by location, allowing users to build up layers of risk metrics using modeled data for each unique locality.
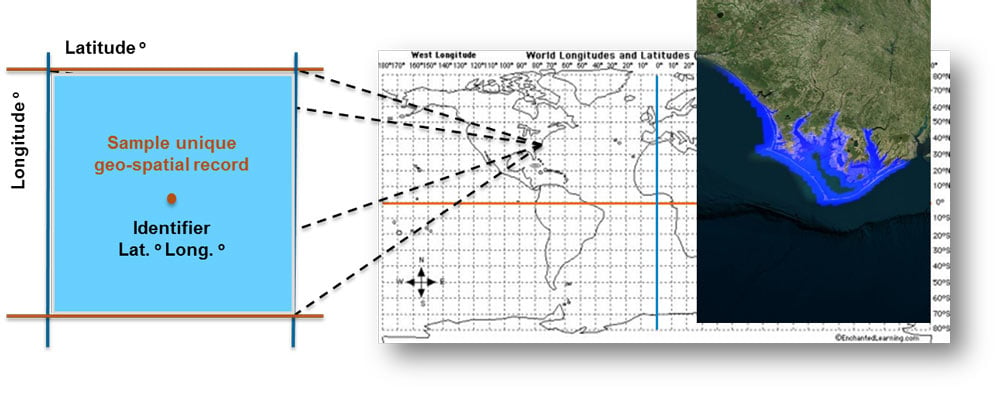
The complex, large volumes of data that contain these location-level attributes—characterized as "big data"—are updated at unprecedented speeds, and are commonly used for analyses and in insurance underwriting. The computational implementation of unique geospatial grid records, alongside big data algorithms for updating, storing, and reusing such records in multiple parallel analyses, enables the user to derive geospatial hazard, insurance, and reinsurance risk metrics for a single risk.
Examining the Different Available Data Layers
A unique geospatial record is able to be linked to multiple dependent data layers, which can contain information on the attributes of the insured risk and modeled data from hazard and financial models. Using big data across multiple layers and from different perspectives provides greater transparency around the insured risk and fundamentally changes the ways an organization can manage its overall risk and optimize its risk selection process.
Next Generation Data Layers
While current functionality provides enhanced transparency and more robust views of risk by location, next generation capabilities will go one step further to directly integrate additional data layers for analyses. These next generation data layers will utilize big data sets typically used in underwriting, and will be organized into three functional layers associated to a common geospatial location:
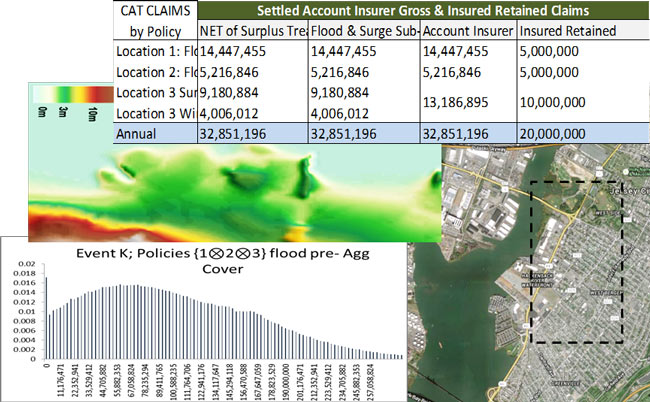
- Exposure Data Layer: contains the physical and engineering attributes and associated insurance premiums of the insured risks, as well as the hazard variables at this unique geospatial location from previous catastrophe events and the associated insurance claims
- Hazard Data Layer: contains geographical and topographical properties of the particular geospatial location, as well as frequency and intensity information from stochastically modeled natural catastrophe events
- Financial Data Layer: contains modeled losses and a range of probabilistic uncertainty and risk metrics
Interdependent layers of structured exposure and historical, hazard, and financial data will enable greater accuracy and flexibility in premium pricing, supported by dependencies and mapping functions across different data types and variables. Such an underwriting ecosystem, with transparency into all data layers and unique variables, is an important prerequisite for promoting optimal policy underwriting practices.
Linking It All Together
The availability of structured and interdependent historical, hazard, and financial data layers will let the policy writer explore the linkages between historical claims, hazard intensities, modeled hazard variables, and losses.
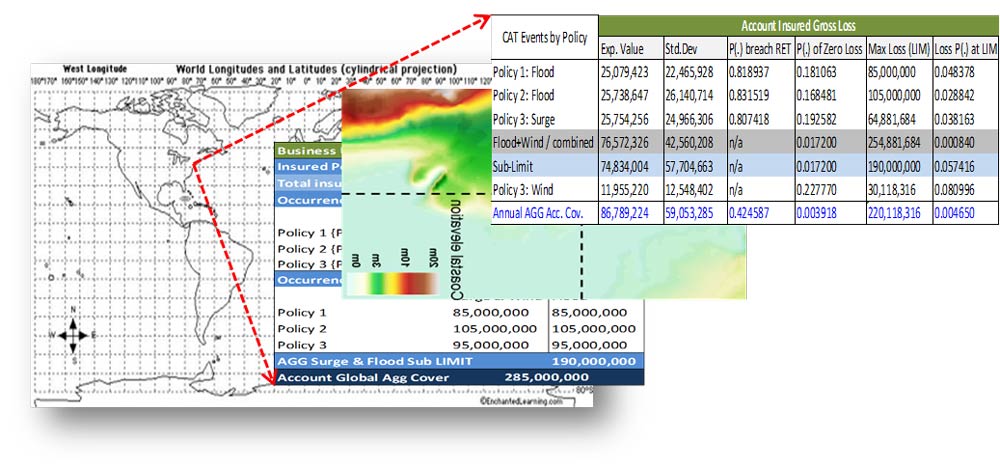
Loss and risk metrics from the financial data layer will contain quantities for Expected Loss, Standard Deviation of Expected Loss, Value at Risk (VaR), and Tail Value at Risk (TVaR) from the full simulated loss distribution (i.e., the exceedance probability curve for a single risk). Other valuable metrics, such as probabilities of zero loss, breaching retentions, and exhausting limits, could also be extracted easily from single risk loss data.
One relatively straightforward use of this information in the underwriting process would be for technical premium development. By exploring the linkages between the historical, hazard, and financial data layers, it is possible to construct the acceptable bounds for the technical catastrophe insurance premium. As a conceptual example, we can expand from the classical insurance premium, I(P), formulation:
Insurance Premium = Expected Loss + some Risk Load*Standard Deviation of Loss
to a more complex premium definition, I'(P), dependent on tail loss risk metrics:
I'(P) = EV.Loss + R'*Std.Dev.Loss + some Function of TVaR
We can then explore the dependencies and boundaries of the historical (Hist) and modeled loss quantities. For example, we could look at the mean, the Standard Deviation, the Value at Risk (VaR), and TVaR, and establish a series of theoretical bounds on our premium to help us limit the associated risk according to the following relationship:
Hist(mean + Std.Dev.) ≤ I(P) ≤ VaR0.004 ≤ Hist{MAX} ≤ VaR0.001 ≤ Hist{MAX + Std.Dev.} ≤ TVaR0.0001
In simpler terms:
- The mean historical loss plus one standard deviation is the lower bound of the premium.
- That premium is less than or equal to the modeled Value at Risk at the 0.04% EP (250 year loss level);
- Which is, in turn, less than or equal to the maximum historical loss;
- Which is less than or equal to the modeled Value at Risk at the 0.01% EP (1000 year loss level);
- Which is less than or equal to the maximum historical loss plus one standard deviation;
- Which is less than or equal to the modeled Value at Risk at the 0.001% EP (10,000 year loss level).
Of course, such intervals are designed by each organization according to its pricing preferences, risk tolerance, market conditions, and business relationships.
In addition to all of the uses we have explored here for next generation capabilities of evaluating risk, the award-winning visualization capabilities currently available in Touchstone's Geospatial Analytics Module are designed to use this same information to provide organizations with rich and intuitive visual insights into accumulations and how they relate to potential hazards.