Despite the loss of life and property from events like Hurricanes Katrina and Sandy, the threat posed by storm surge is still largely underestimated. To more clearly express that threat the National Hurricane Center (NHC) has announced that at the beginning of the 2015 Atlantic hurricane season it will provide an experimental graphical depiction of areas threatened by storm surge.
The prototype storm surge graphic will use the NHC's familiar watch/warning terminology and will highlight those areas along the Gulf and Atlantic coasts of the United States that have a significant risk of life-threatening inundation by storm surge from an approaching tropical cyclone.
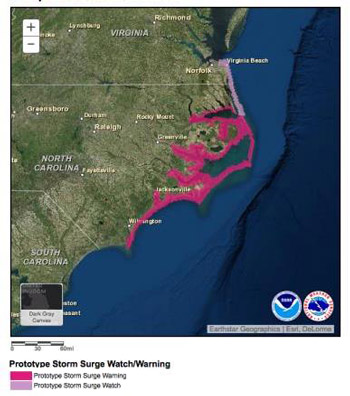
This prototype storm surge watch/warning for a hypothetical hurricane event shows what the new graphic will look like (Source: NHC)
Surge will be classified into two categories of severity: watch and warning. While simplistic, this is the first time the NHC has officially assigned a classification to the storm surge hazard, and will assist in effectively communicating to residents, emergency planners, and other officials the necessity and timing of potential evacuations.
In the case of storm surge, classifying the severity of potential impact has a far broader effect on evacuation than the current classification of wind hazard. Hurricane winds, while dangerous, do not generally prompt the large scale evacuations seen when storm surge is threatening to impact a region. The old adage' hide from the wind, run from the surge' is still generally regarded as being legitimate by emergency planners and put into practice in many cases when a hurricane is bearing down on the coast.
This new watch/warning classification for storm surge complements the Experimental Potential Storm Surge Flooding Map introduced by the NHC a year ago. These maps display depths of inundation that have a 10% chance of being exceeded during a hurricane.
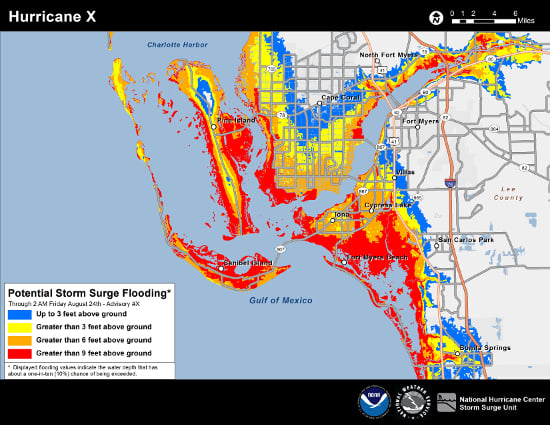
Example of NHC potential storm surge flooding for a hypothetical hurricane in the Fort Myers, Florida, region (Source: NHC)
The NHC runs an event through its Probabilistic Hurricane Storm Surge with Tides (P-Surge2.0) process to develop these maps. A simulation event set is created by perturbing a forecast event based on historic errors in forecasting landfall location, radius to maximum winds, forward speed, and intensity. This perturbed event set provides a nearly all-encompassing view of potential surge inundation scenarios, providing NOAA and emergency planners with an estimation of worst case storm surge inundation.
Once the probabilistic surge elevation surfaces have been generated, inundation depths are calculated by subtracting high resolution topographic data provided by the NOAA Coastal Services Center. The inundation depths obtained are displayed in the Potential Storm Surge Flooding Map.
If the process of subtracting high resolution topographic data from surge elevations to create surge depth footprints sounds familiar, that's because it is identical to the process implemented in AIR's new storm surge model!
As part of a phased implementation, NHC plans to consolidate the dissemination of wind and surge watches and warnings in 2016. This new process will merge inland and coastal warning information for both threats into a single message and is expected to become fully operational in 2017.