In Europe, windstorms can be like London busses: you wait forever and then several come along together. This clustering is a natural feature of extratropical cyclones over Europe. Just think back to the 2013-2014 winter season, when Xaver, Dirk, Anne, and Christina (to name a few) followed one after the other.
Over the last few years I have noticed that clustering is a topic in which the insurance industry is increasingly interested, with the primary question being: What is the impact of clustering on my losses?
To address this question, we performed an exercise using the AIR Extratropical Cyclone Model for Europe. This model has clustering built into it, so removing both the clustering and its resulting impact took a little thought.
The method we decided to adopt uses the Event Loss Table (ELT) produced by an analysis in Touchstone®. By replacing the stochastic year (the second column in the table below) with a new year randomly sampled from the range 1-10,000 (first column), a new ELT is generated. In essence, this new ELT represents what a ‘declustered’ view of the risk might look like.
An Event Loss Table (ELT) produced by the AIR Extratropical Cyclone Model for Europe. The last four columns represent the standard ELT, which includes the stochastic year, event ID, and stochastic day, along with the associated loss. The "New Year" is randomly sampled from 1-10,000, representing a ‘declustered’ ELT.
| “New” Year | Stochastic Year | Event | Day | Loss |
| 9597 | 1 | 1 | 16 | 133,763,525 |
| 8862 | 1 | 2 | 20 | 128,241,874 |
| 9249 | 1 | 3 | 73 | 16,585,640 |
| 9365 | 2 | 4 | 75 | 3,178,112 |
| 9107 | 2 | 5 | 342 | 493,785,876 |
| 7836 | 2 | 6 | 345 | 61,225,262 |
| 5794 | 2 | 7 | 349 | 427,097,128 |
| 2268 | 2 | 8 | 360 | 341,548,922 |
| 6225 | 3 | 9 | 26 | 2,000,530,299 |
| 9053 | 5 | 10 | 352 | 202,785,417 |
| … | … | … | … | |
| 9312 | 10,000 | 53,036 | 37 | 129,316,175 |
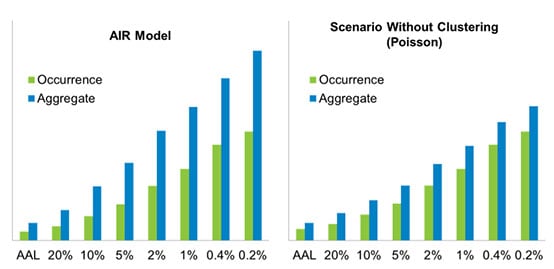
As you can imagine, the greatest impact of ‘declustering’ is on the aggregate exceedance probability (EP) curve, as shown in the graphs below. This is the result of redistributing events that were previously in the same year across multiple years. From a reinsurance point of view, this potentially impacts not just the amount of reinsurance, but also the number of reinstatements being purchased.

EP curves produced by the AIR Extratropical Cyclone Model for Europe showing the impacts of clustering (left) and 'declustering' (right) the ELT. Note that the graphs are on the same scale.
The impact of this ‘declustering’ process is not, however, necessarily always as large as that shown above. The magnitude of the impact tends to scale with the size of the area being considered. For example, if you consider an area the size of Belgium, it is easier for a storm to ‘miss’ the country and produce fewer loss-causing events per season than in a country the size of France. Hence, for Belgium, the impact of ‘declustering’ is smaller.
Clustering is not a user-specified option in Touchstone. After all, nature isn’t optional. Clustering is real and therefore an integral part of modeling European windstorms effectively. For more discussion of clustering-related topics, read European Windstorms: Implications of Storm Clustering on Definitions of Occurrence Losses, or my AIR Currents article, Extraordinary Weather, Ordinary Losses: The 2013-2014 Extratropical Cyclone Season in the UK.


