When I had to choose what I wanted to do when I grew up, my options were architecture and a math-based career like actuarial science. I thought deeply, and to make a more informed choice, took a course on architecture. There was something very appealing about sitting with simple tools like a pen and paper and sketching a beautiful design from which would come a physical reality-someone's home.
Ultimately however, I recognized the beauty in mathematics and didn't become an architect. But architecture and mathematics aren't as different as they may seem-in their purest form both require you to sit with a pen and paper and use creativity to solve problems. Many mathematicians over the centuries have seen the beauty and symmetry in mathematical equations and Ian Stewart even entitled his book on mathematics and symmetry "Why Beauty is Truth."
The principle that design should be beautiful is one I've maintained throughout my career, only these days I'm concerned with information design. Mathematical formulae can be beautiful, and so can the graphs that accompany their results. This is where information design comes in.
Information design is truly a 21st century field of study, and it has been gaining ground with the rise of big data and the need to find and display patterns in massive data sets-sometimes gigabytes or even terabytes of data. Infographics exploring new ways of displaying information quickly and effectively have become increasingly popular.
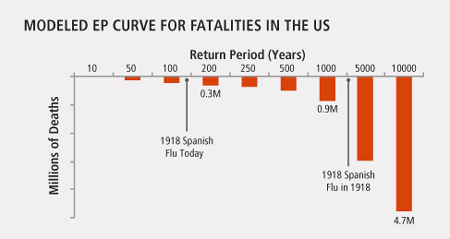
At AIR, I have been experimenting with various visualization techniques. Inverted bar charts like the one from AIR's pandemic infographic below, can be used to display something negative and capture the reader's attention quickly. Careful color choices can enhance impact. We used red hereto suggest blood and mortality.
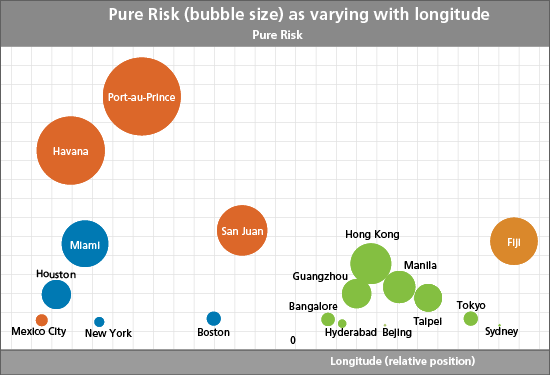
Using bubbles instead of bar or line charts to represent values can often make for a more visually appealing experience and encourage reader interest. Readers often pay more attention if information is displayed in a simple and novel form-bubble charts can be used to provide a third dimension to a two dimensional plot. Here is an example from one of my upcoming blogs in which each dot's coordinates, size, and color convey information:
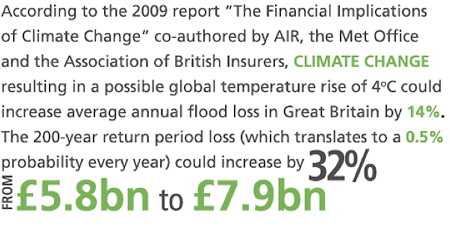
Old tricks, like increasing font size, boldness and color, are still great ways to capture reader attention and highlight key statistics.
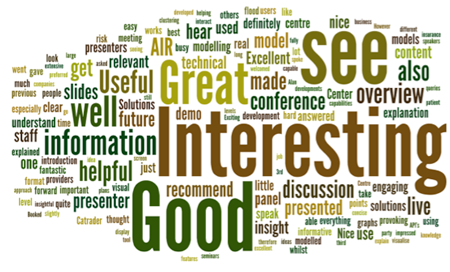
Wordle, a fairly new form of visualization, can be particularly useful when trying to glean information from large amounts of text-here is one created using client feedback from AIR's Envision Europe 2014 conference.
Insightful ways of displaying information are increasingly relevant in a world with more and more data. It is something we are continually working on here at AIR and users will undoubtedly notice increased visualization capabilities in the years to come in both our publications and in Touchstone®.
Check out more of AIR's infographics in ourimage gallery.