


Every year a variety of private and public organizations issue forecasts of activity for the North Atlantic hurricane season, which spans June 1 to November 30. These forecasts typically predict the number of named storms (which include all tropical storms with sustained wind speeds above 40 mph), hurricane count(wind speeds above 74 mph), major hurricane count (Category 3 and above) and, less often, the ACE (Accumulated Cyclone Energy) Index.
The algorithms for these predictions are based on a combination of statistical analyses of past seasons, the relationship of key climate factors such as Atlantic sea surface temperatures and El Niño/La Niña driven wind shear. Each organization uses a slightly different algorithm for forecasting, and most issue a range of counts, recognizing the considerable uncertainty involved. Publication of the predictions can start as early as late December the prior year, but most are issued between March and the start of the season on June 1. Often, forecasts are updated mid-season-in August or September.
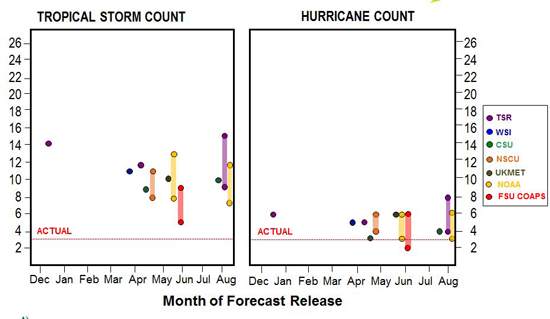
Last year, hurricane forecasts varied considerably: between 10 and 20 named storms were forecast (UK Met Office, or UKMO, and NOAA respectively), forecasts of hurricane count varied from 4 to 14(UKMO), and the number of major hurricanes ranged from 1.8 to 6 (TSR and NOAA respectively).
The actual numbers by the end of the season, however, told a different story. There were 14 named of storms (with 7 of the companies forecasting correctly), 2 hurricanes, and no major hurricanes. Amidst the high predictions, the intensity of last year's hurricane season was a dud; it produced the lowest number of hurricanes since 1982 and, for the first time since 1994, no hurricane intensified to Cat 3 status.
So given we are now half way through the 2014 season, how is it shaping up relative to forecasts?
The forecasts, of course, are for end of the season totals, so we should expect the actual counts to be considerably lower than forecast at this stage-not only because we're only at mid-season, but also because September is historically the most active month. Currently the figures are as follows:
Thus far, tropical storm and hurricane counts are generally lower than in 2013. We've touched on this issue in our blog posts Hurricane Prediction Is Very Difficult, Especially if It's About the Future and Will There Be an El Nino this Year? From a climatological (long-term historical) perspective, by September 1 we should have seen 5 named storms, 2 of which would have become hurricanes. So we are "behind schedule" in terms of named storms, but "ahead of schedule" for hurricanes.
How does the rest of this season need to look for the pre-season forecasts to verify? And is that even possible? On average, after September 1 we experience about 6 named storms, with 4 of them becoming hurricanes. Were those averages to be realized, the forecasts would look better, with named storms on target and hurricanes a bit above forecast.
Again, the hurricane season is now entering its most active period, and late August to October 1 is when the Gulf Coast traditionally sees the most storms. Although the first half of the hurricane season has proved to be relatively quiet, anything could happen in the next few months. As with any Atlantic hurricane season, it ain't over 'til it's over.
