In my previous post, I analyzed a simple account and presented the results in a few different ways to understand the role non-catastrophe losses play in the overall risk profile of that account. In this post, I'd like to take a closer look at some of the tools used to perform that analysis, specifically the ISO® data elements that are available in Touchstone®.
The first step I took in the non-catastrophe analysis was the calculation of the ground-up expected loss. This was done using ISO Advisory Prospective Loss Costs for Commercial Property-specifically for the Basic Group I perils (fire,lightning, explosion, vandalism and malicious mischief, and sprinkler leakage). ISO loss costs are a powerful tool for underwriters; they are based on a vast amount of loss data collected by our sister company, and they are well known and widely used throughout the property and casualty industry.
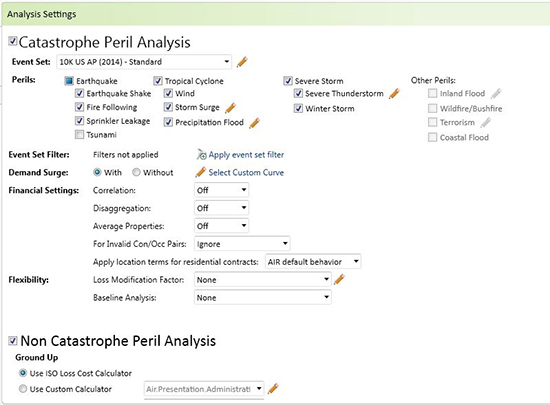
These loss costs now reside within Touchstone, along with an engine that will calculate the expected non-cat loss for each location within an exposure set. This is all done seamlessly using the same data that is imported for a catastrophe analysis, as reflected in the analysis settings screen.

The Touchstone analysis settings screen
These expected losses can be carried forward into the next step as I did in the analysis described in my previous post and/or used within a pricing process. And even if I, as an underwriter, believe the account I am analyzing isn't well suited to using the ISO loss costs, the calculated value is still helpful to me as a benchmark to see how my own view compares with the industry's. As an alternative, I could have imported my own view into Touchstone as a custom loss cost and performed the analysis in that way.
The second step in the analysis was to distribute my ground-up expected loss into appropriate layers of coverage. There are various methods used to accomplish this, including the Ludwig first loss curves, or the Lloyds scales, but what we've done within Touchstone is to leverage the ISO Property Size-of-Loss Database, or PSOLD™.
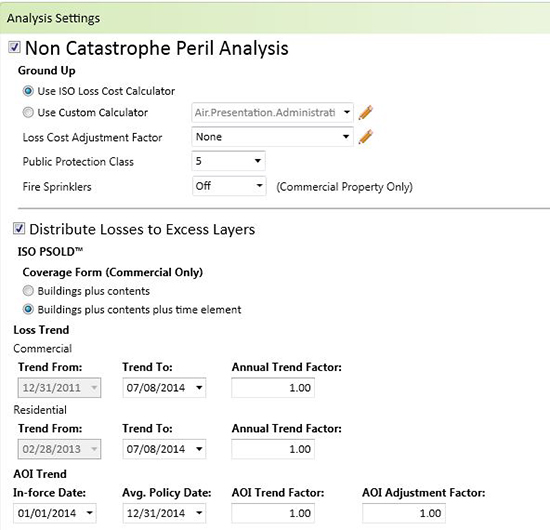
PSOLD also takes advantage of the large amount of claims data collected by ISO and creates what we believe to be the most robust set of first loss curves in the industry. Like ISO loss costs,these curves are now available within Touchstone and are set up to be applied automatically in circumstances where the exposure data contains excess or blanket layers of coverage, as well as any excess per risk treaties. We've included many of the same options found within the PSOLD product so that current users can have the same flexibility they have now.

The non-catastrophe peril analysis screen in Touchstone
In these two posts, I've shown the importance of non-catastrophe perils to the risk profile of a specific account and also the ease with which it can be done within the Touchstone platform. Everything displayed here has leveraged the exposure data already imported into the software for catastrophe modeling, potentially removing an additional data transfer step within an underwriting workflow. This moves us further toward our goal of providing powerful tools for our clients and allowing you to more fully own your risk.
To learn more about other enhancements available in Touchstone 2.0, please visit this webpage.
