


The 2003 Cedar Fire: A Record-Breaking WUI Fire
Oct 15, 2018
Editor’s Note: October marks the 15th anniversary of the 2003 Cedar Fire, which quickly transitioned to a wildland-urban interface (WUI) fire that was then exacerbated by Santa Ana winds and wreaked havoc across San Diego County. Until recently, the Cedar Fire was the largest California had ever seen; it remains the third-largest and third-most destructive in California history, and demonstrates the devastation that can occur in the WUI—an area where human development meets or intermingles with undeveloped wildland.
Until recently, the record for the largest California wildfire was held by the 2003 Cedar Fire, which blazed through San Diego County and burned more than 273,000 acres and destroyed more than 2,800 structures. Fifteen years later, the Cedar Fire remains the third-most destructive and third-largest wildfire in California history (Table 1 and Table 2). Using the AIR Wildfire Model for the United States, AIR estimates that the Cedar Fire would result in insured losses of about USD 3.5 billion if it were to recur today.
The Tubbs and Thomas fires at the end of 2017 and the Carr and Mendocino fires this year have served as reminders of how large and destructive wildfires can be (Table 1 and Table 2), especially in the WUI—the area most at risk.
| Event | Date | County | Acres Burned |
|---|---|---|---|
| Mendocino Complex | July 2018 | Colusa, Lake, Mendocino, and Glenn |
459,123 |
| Thomas | December 2017 | Ventura and Santa Barbara | 281,893 |
| Cedar | October 2003 | San Diego | 273,246 |
| Rush | August 2012 | Lassen | CA: 271,911 NV: 43,666 |
| Rim | August 2013 | Tuolumme | 257,314 |
| Zaca | July 2007 | Santa Barbara | 240,207 |
| Event | Date | County | Structures Destroyed |
|---|---|---|---|
| Tubbs | October 2017 | Napa and Sonoma | 5,636 |
| Tunnel | October 1991 | Alameda | 2,900 |
| Cedar | October 2003 | San Diego | 2,820 |
| Valley | September 2015 | Lake, Napa, and Sonoma | 1,955 |
| Witch | October 2007 | San Diego | 1,650 |
| Carr | July 2018 | Shasta and Trinity | 1,604 |
Ignition, Spread, and Containment of the Cedar Fire
At 5:35 p.m. on October 25, 2003, a lost hunter lit a small signal fire at the bottom of a canyon in the Cleveland National Forest. A federal rule prohibiting the flight of firefighting aircraft later than 30 minutes before sunset prevented aerial suppression efforts and left ground crews to look for the flames of the growing fire. Due to overgrown brush and the propensity of fires to blaze uphill quickly, firefighters could only wait for flames to approach the dirt road half a mile away.
 Tammy Viggato
Edited by Rachel Wisch, CEEM
Highlights
- The 2003 Cedar Fire was the largest wildfire on record when it raged in October 2003, and the most destructive fire to affect California since the 1991 Oakland Fire; after the fires of 2017 and 2018 (so far), it ranks third in size and destruction for the State of California.
- The Cedar Fire quickly escalated to a wildland-urban interface (WUI) fire; the WUI is the area where human development meets or intermingles with undeveloped wildland. The WUI is also where the largest insured losses from wildfire in the United States have occurred, as it is the area most at risk.
- The AIR Wildfire Model for the United States uses a physically based approach to realistically capture the spread and behavior of wildfires for more accurate risk assessment and management.
Initially, the fire held at 20 acres. Less than a day later, however, that small signal fire exploded to 62,000 acres, traveled almost 30 miles, jumped the San Diego River, and crossed into the City of San Diego, thanks in large part to Santa Ana winds—strong, hot, extremely dry winds that descend to the Pacific Coast from inland desert areas. The Santa Ana winds, however, are just one environmental condition that exacerbated the Cedar Fire. Low humidity and warm temperatures had dried out fuels and likely contributed to the spread.
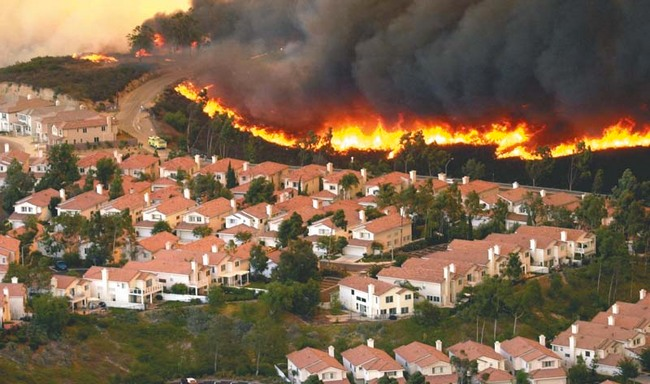
The first house caught fire in San Diego Country Estates, just 8 hours after the fire was first reported—at 1:16 a.m. Later that same day, the Cedar Fire approached the nearby community of Ramona in San Diego County (Figure 1). Flames as high as 100 feet were reported near Scripps Ranch. By 6:00 p.m. on October 27, the Cedar Fire had grown to more than 20,000 acres, surpassing the Laguna Fire of 1970 to become the largest fire San Diego County had ever experienced. Smoke and ash filled the air in surrounding towns, making breathing difficult and daily life almost impossible on October 28; schools, courts, and businesses were forced to close. When it reached more than 250,000 acres on October 29, it set a new record for the largest wildfire in California history.
Firefighters achieved two-thirds containment (i.e., the establishment of a control line around a fire and inhibition of fire spread) on October 31, when the Cedar Fire had reached its maximum size. It wasn’t until November 3 that 100% containment was achieved.
The Wildland-Urban Interface (WUI): Where the Largest Insured Losses Have Occurred
The Cedar Fire quickly escalated from a wildland fire to a wildland-urban interface (WUI) fire. The WUI is an area where human development meets or intermingles with undeveloped wildland, and it is the zone where the largest insured losses from wildfire in the United States have occurred. Approximately one-third of U.S. homes are in the WUI, with 4,000 acres per day converting from wildland to WUI through residential development—even in the most fire-prone regions. Several hundred thousand businesses and an estimated population of more than 120 million people are also located in the WUI.
The proximity of WUI developments to wildland full of fuels puts them at increased risk, as was the case with the Cedar Fire. Fires may start burning in less-populated areas, but they can travel great distances and potentially into more densely populated areas when strong winds blow embers beyond the flames. Wind-borne embers that land on roofs and set structures on fire is known as fire branding/spotting and is the primary way fire moves through urban areas.
Continued expansion of the WUI is the main driver of the increases in insured losses from wildfire. More exposure exists in previously undeveloped areas and today’s structures have higher overall costs—from construction materials to finishes to floorplans.
Human Activity Contributes to Wildfire Risk
Human activity can change the distribution of fire ignitions. While lightning-caused wildfires tend to follow natural patterns and long-term climatic conditions, human-caused ignitions follow road networks—especially near the WUI. These road networks give people easy access to wildland where fires can be ignited, and fires often follow road networks as they spread. And while one homeowner may be diligent at managing fuels on their property (such as removing dead shrubs or cutting back trees and branches that are too close to their house), the community’s ability to mitigate wildfire risk is contingent upon similar efforts from their neighbors.
Managing U.S. Wildfire Risk Using a Probabilistic Approach
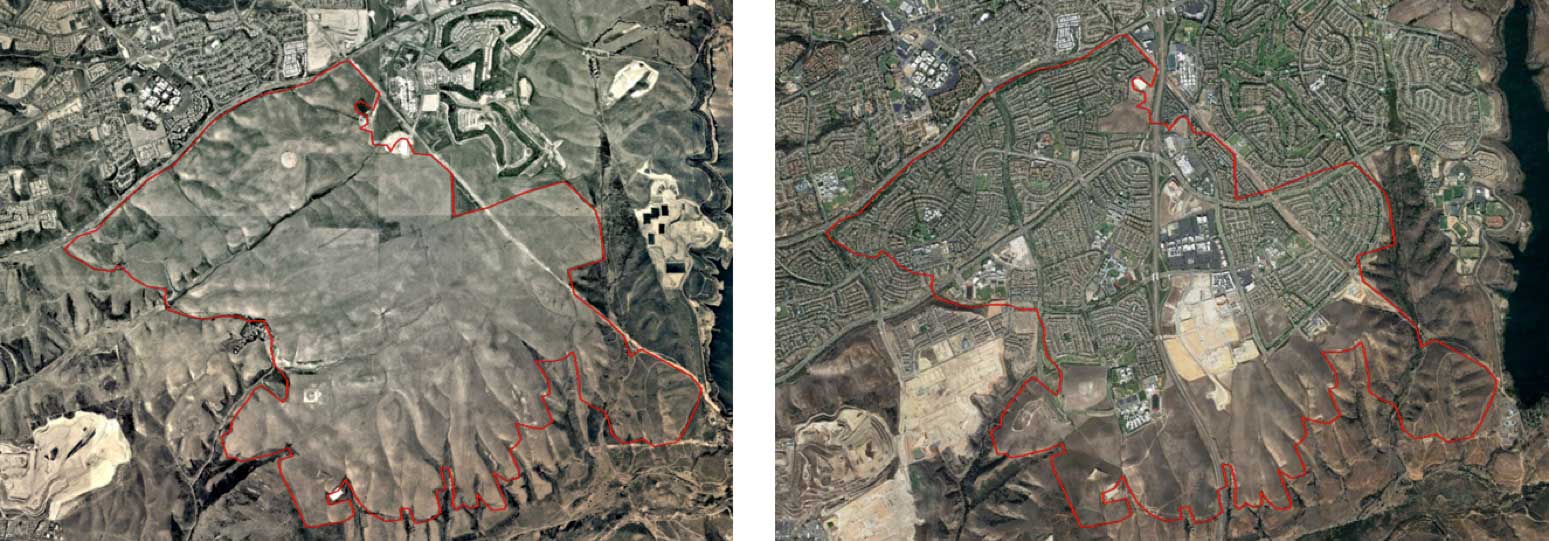
In an ever-changing landscape with a growing population, depending on historical experience alone won’t help insurers manage their wildfire risk; the types and distributions of exposure and fuels today vary from those of the past (Figure 2).
The AIR Wildfire Model for the United States captures the wildfire risk in the 13 western U.S. states where the most significant wildfire losses have occurred. The most comprehensive wildfire model available for the region, it explicitly accounts for all the ways a fire can spread, including to and through urban settings—most commonly due to fire branding/spotting, as was the case in the Cedar Fire. The model uses a probabilistic approach that considers today’s environment and conditions, such as the Santa Ana winds that exacerbated the Cedar Fire, to provide a realistic view of wildfire risk not achievable with historical experience alone. The combination of circumstances that lead to urban conflagration events—large, destructive fires that move beyond the WUI and penetrate an urban area—are also explicitly modeled. AIR’s innovative U.S. wildfire model enables companies to develop a realistic understanding of their wildfire risk so that they can make more informed decisions, more effectively manage portfolios and exposure concentrations, consider risk financing strategies, and enhance resilience.
