


Preview of the 2017 Atlantic Hurricane Season
Jun 14, 2017
Editor's Note: The current 12-year stretch without a major U.S. hurricane landfall is the longest on record. Early seasonal forecasts of below average hurricane activity this year due to expectations of a moderate El Niño suggested the possibility that the record might be extended. However, the latest forecasts turned that around and now point to slightly above average activity. One thing is certain: Seasonal forecasting is inherently uncertain and, from a loss standpoint, anything can happen.
By convention, the Atlantic hurricane season begins June 1 and ends November 30, but these dates describe only when most tropical cyclones form, and storms can—and occasionally do—develop earlier or later in the year. This year, for the third year in a row, a tropical cyclone formed in the Atlantic before June 1. Although Tropical Storm Arlene was named on April 20, an early storm does not necessarily herald an active season, and Arlene was a false start that fizzled harmlessly mid-ocean the next day. So what can we expect this year?
Tropical Cyclone Activity Predictors
Several factors influence tropical cyclone development, but one of the most important is the El Niño–Southern Oscillation (ENSO), which is described by the National Oceanic and Atmospheric Administration (NOAA) as “a periodic fluctuation in sea surface temperature and the air pressure of the overlying atmosphere across the equatorial Pacific Ocean.” ENSO can have a significant impact upon the world’s weather systems, and can either foster or hinder hurricane development.
A period with elevated sea surface temperatures (SSTs) is known as El Niño, and the corresponding period of cool SSTs is known as La Niña. El Niño tends to increase the number of tropical storms in the eastern Pacific, but it also increases vertical wind shear in the Atlantic; in doing so it helps to temper tropical cyclone formation in the Main Development Region (MDR).
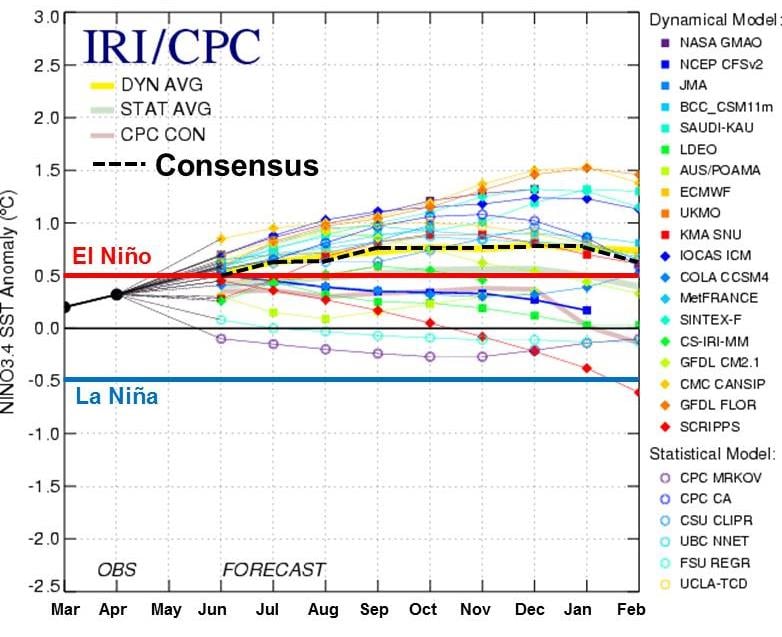
The recent La Niña was declared over in February 2017, and the oscillation is in its neutral phase. As sea surface temperatures increase in the equatorial region of the central and eastern Pacific, however, El Niño conditions are more likely than not to return later in the season—unusually soon after the strong El Niño of 2015. In recent weeks revised forecasts reflect a slight downturn in the strength of the anticipated El Niño, but they still suggest that a mild one may develop. Figure 1 shows the plume of ENSO predictions as of mid-May, with a weak El Niño (SST anomaly < 1°C) indicated by the consensus (dotted line).
Another major factor influencing hurricane activity is the Atlantic Multidecadal Oscillation (AMO), a natural variability of SST and sea-level pressure fields in the North Atlantic. Alternate periods of warm or cool SST anomalies occur across the North Atlantic from the equator to Greenland and typically last 20 to 30 years. Warm periods correlate with increased tropical cyclone frequency and cool periods with less activity in the basin.
The current warm phase began in the mid-1990s, and the three unusually quiet hurricane seasons in 2013, 2014, and 2015 have led to speculation that the warm phase is ending and transitioning into a cool phase. However, the relatively active hurricane season in 2016, including two U.S. landfalling hurricanes, has added to the uncertainty—and it is still far from clear that a transition has begun. Moreover, the AMO index itself remains positive, with no indicative decreasing trend. Figure 2 shows the month-to-month variability in sea surface temperature anomaly from 1950 to the present.
 Eric Uhlhorn, Ph.D.
Manager, Principal Scientist
 Michal Clavner, Ph.D.
Scientist
Edited by Jonathan Kinghorn, CCM
The article:
- The longest recorded major hurricane landfall drought in United States history continues.
- Forecasters now predict a slightly above average season and mild El Niño conditions, but unpredictable secondary factors will influence the season’s development.
- There is no strong correlation between storm formation and U.S. landfalls, and even inactive seasons can lead to catastrophic losses.
Atlantic Hurricane Season Forecasts Predict Slightly Above Average Activity
Since Colorado State University issued the first hurricane season forecast, in 1984, several other organizations have started publishing them using various predictors of seasonal activity. The earliest forecast for 2017 (from the Tropical Storm Risk (TSR) Consortium of the University College London) appeared on December 13, 2016, but most are issued in April or May, and several are updated as the season approaches and progresses. While the forecasts for 2017 vary in detail, the most recent are in general agreement that the Atlantic is likely to experience slightly above average activity this year.
Table 1 indicates that in the years 1891–2010 there have been, on average, 12.1 named storms, 6.4 hurricanes, and 2.7 major hurricanes (Category 3 and above).
| Source | Named Storms | Hurricanes | Major Hurricanes |
|---|---|---|---|
| NOAA | 11–17 | 5–9 | 2–4 |
| University College London | 11 | 4 | 2 |
| Colorado State University | 11 | 4 | 2 |
| Weather.com | 12 | 6 | 2 |
| North Carolina State University | 11–15 | 4–6 | 1–3 |
| AccuWeather | 10 | 5 | 3 |
| Climatological Average (NOAA) | 12.1 | 6.4 | 2.7 |
For 2017, the principal hurricane season forecasts are predicting activity at slightly above average levels, with 11–17 named storms, 4–9 hurricanes, and 1–4 major hurricanes.
Uncertainty Remains
The SSTs that impact ENSO and AMO change slowly from one year to the next. Forecasts for 2017 suggest average or slightly elevated SSTs in the MDR, but SST is only one of many influences on hurricane activity. Secondary factors include El Niño weather impacts, the Saharan Air Layer, the Madden-Julian Oscillation, the Thermohaline Circulation, and the North Atlantic Oscillation. Although scientists understand the links between these phenomena and hurricane formation, the inherent randomness and variability of hurricane formation and tracking toward landfall are much greater than the influence of all these factors put together on landfall risk. Even perfectly accurate SST forecasts would not make landfall risk more predictable, given the current state of knowledge.
Since 2007, AIR has released two catalogs for its U.S. hurricane model: a standard catalog that reflects hurricane risk under average climate conditions, and a supplemental catalog, which “conditions,” by way of indices, the standard catalog using data only from those years since 1900 when SSTs have been higher than the long-term average. It should be noted that because these indices are based on a subset of years, the warm sea surface temperature (WSST) catalog is characterized by higher uncertainty. Thus it is offered as a supplement to, rather than a replacement for, the standard catalog. Compared to the standard catalog, the WSST view of risk is approximately 10% higher in hurricane counts nationwide, although regional differences can be higher still. The actual storm count has tracked near or between the standard and WSST views, dipping below the standard view some years and rising above the WSST view in others.
What Will the 2017 Hurricane Season Bring?
The moderate El Niño previously forecast for the peak of the season is now likely to be a weak one, if it materializes at all. Thus forecasts for hurricane activity have been revised upward to slightly above average levels. It is important to remember, however, that a forecast of slightly above average basin activity does not necessarily presage elevated insurance losses. There is, for example, no strong correlation between the number of tropical storms that form and U.S. landfalls in any given season. An active season can produce many storms but few U.S. landfalls. And while not all landfalling systems impact exposure and produce significant damage, just one major hurricane can inflict record-breaking losses, as happened 25 years ago when Hurricane Andrew devastated South Florida. Conversely, a series of tropical storms and lesser hurricanes can have as much cumulative impact on the insurance industry as one or two major hurricanes. Furthermore, as Hurricane Matthew so ably demonstrated last year as it moved northward along the coast of Florida just offshore, even a bypassing storm can inflict significant damage.
It is tempting at the outset of another Atlantic hurricane season to try to extrapolate a picture of the season’s risk from recent climatic activity. Yet the complexity underlying landfalling tropical cyclone risk is the very reason that researchers at AIR have long advocated for a robust approach to estimating risk based on as many years of data as possible. AIR’s standard and WSST catalogs both provide a long-term and stable view of risk from landfalling hurricanes. Each incorporates the latest scientific research and has undergone extensive peer review by leading scientists. By providing two catalogs for the U.S. Hurricane Model, AIR encourages clients to assess variability and uncertainty, which are fundamental to managing risk.
