


Imagining the Worst: What if the Oroville Dam’s Auxiliary Spillway Failed Catastrophically?
May 16, 2017
Editor’s Note: In this article, AIR Engineers Nathaniel Adams and Matthew Hergott discuss AIR's modeled scenario of a potential catastrophic failure of the auxiliary spillway for the Oroville Dam, including the assumptions made concerning the hydraulics of a potential spillway failure, what could lead to such an event, and what the modeled results are.
During the winter of 2017, heavy rainfall across northern California increased the water level of Lake Oroville, the reservoir behind the Oroville Dam, to an elevation that prompted the dam’s operators to use the dam’s main spillway to discharge water at the rate of 50,000 cubic feet per second. The water’s force caused a hole in the structure, which proceeded to grow rapidly. With the lake filling faster than it could be discharged—and the main spillway compromised, causing a temporary halt to its use—the emergency, or auxiliary, spillway was utilized for the first time since 1968, when the dam became operational. The auxiliary spillway was soon overtopped. While neither the dam nor the main spillway was at risk of catastrophic failure, the auxiliary spillway experienced sudden and significant erosion, prompting the evacuation of nearly 200,000 people downstream of the dam. (To learn more about this event, please read “This Time We Were Lucky: The Oroville Dam Emergency.”)
But what if the auxiliary spillway had catastrophically failed? Using a Graphics Processing Unit (GPU)-based 2D Shallow Water Wave model developed at AIR, we simulate a scenario to explore this very possibility. In the following sections, we discuss the assumptions we made concerning the hydraulics of a potential spillway failure, what could lead to such an event, and what the modeled results are.
Model Assumptions
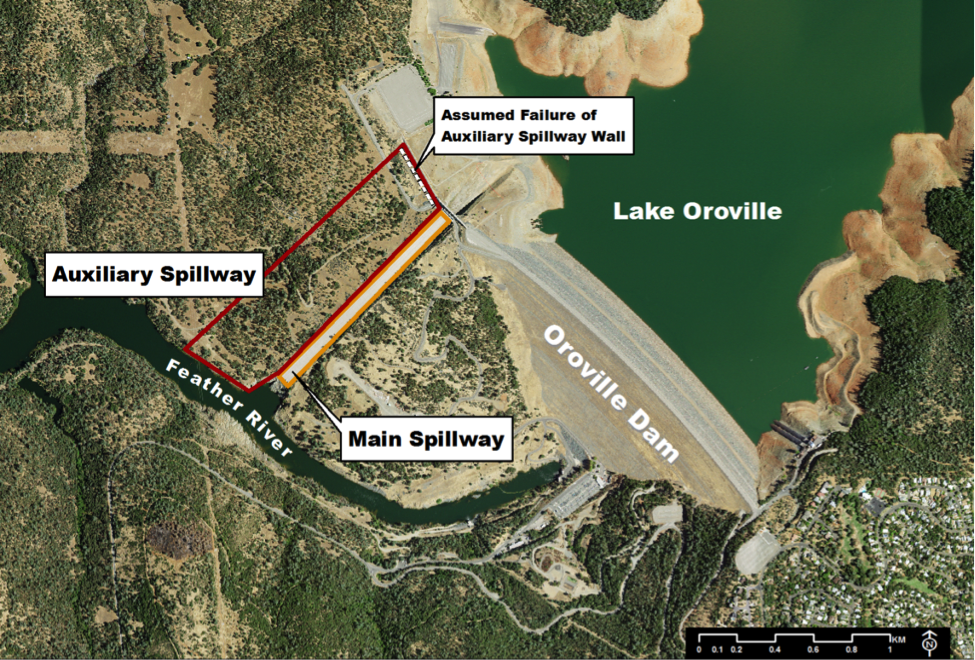
The auxiliary spillway of the Oroville Dam consists of an earthen hillside topped by a 30-foot high concrete wall adjacent to the dam. When significant erosion to this spillway occurred upon its use this past winter, dam operators were concerned that further use would cause continued headward erosion of the hillside, meaning erosion of the hillside in the opposite direction of the flow. When the flow over the spillway began eroding the hillside, the eroded area did in fact begin growing in a headward direction, which, if left unchecked, could have potentially undermined the concrete wall. The scenario AIR modeled contemplates the complete failure of a 900-foot long section of this wall over the course of one hour, thus allowing water to flow out of the lake and into the Feather River at a peak rate of about 388,000 ft3/s (11,000 m3/s). The modeled domain extends 56 miles (90 km) downstream of the Oroville Dam.
We estimated from lake bathymetry taken from U.S. Geological Survey (USGS) topographic maps1 that the volume of water in the lake available to flow out through the failed spillway was 19.5 billion cubic feet or 146 billion gallons, in addition to the observed inflow to the lake from rainfall and snowmelt between February 7 and February 13. Inflow was taken from provisional Lake Oroville inflow measurements posted on the California Data Exchange Center’s (CDEC) website2 for the period between February 7 and February 13, 2017. Flows in rivers other than the Feather River, such as the Yuba and Sacramento rivers, are not considered in this simulation. Not all levees are captured in the model elevation data set, and flood control structures and floodways such as the Sutter Bypass that might help mitigate inundation were also not considered.3
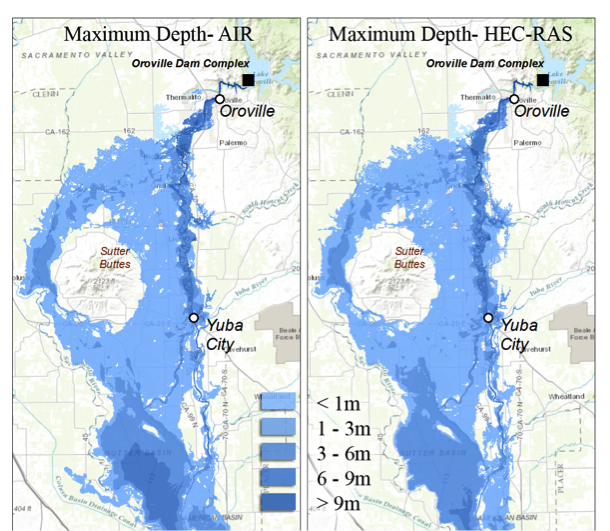
As a reasonability check, we performed the same simulation using the U.S. Army Corps of Engineers 2D HEC-RAS model. Figure 2 shows the comparison between results using the HEC-RAS model and the in-house AIR model. Flood depths and extents from the in-house AIR model closely match those produced by the HEC-RAS model, but the AIR model runs faster, thanks to the use of GPU technology.
Flooding Inundates a Large Area
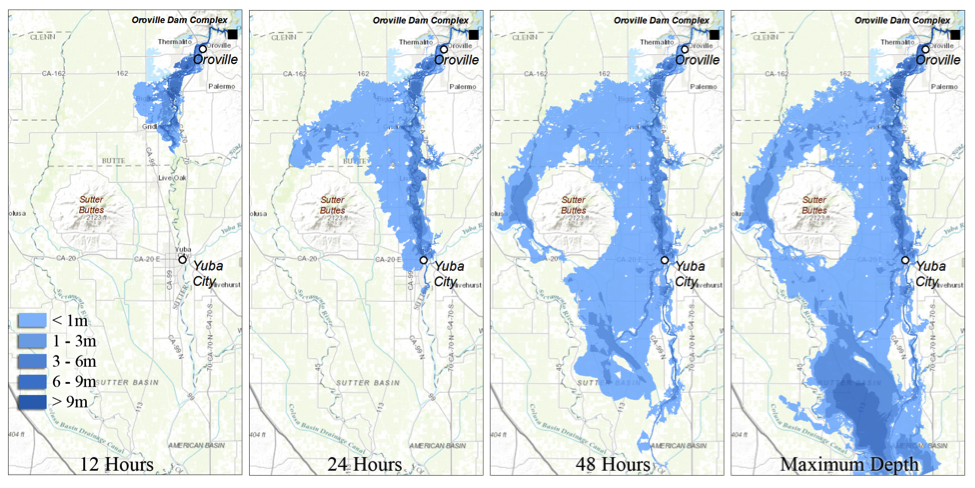
Under the assumptions made for this simulation, both Oroville and Yuba City experience widespread flooding, with the floodwave reaching them in roughly 5 and 21 hours, respectively. The maximum flood depth in both Oroville and Yuba City is approximately 11 feet. Because the Sacramento Valley is essentially flat, the inundation area is large and shallow; an area of about 570 square miles (1475 km2) is inundated during the course of 72 hours. Figure 3 shows the 12-hour, 24-hour, 48-hour, and maximum flood depths, respectively.
Watch the time-lapsed (55-second) animation of the propagation of floodwaters due to an AIR-modeled catastrophic failure of the Oroville Dam’s auxiliary spillway.
Large portions of the Sacramento Valley south of Oroville Dam are also affected, comprising agricultural land for the most part, as well as numerous small towns and wildlife areas. The flooding extends to the west side of Sutter Buttes, which is a volcanic plug in the middle of the Sacramento Valley that the flood wave surrounds. The east side of the Feather River experiences a smaller flood footprint, as the river is close to the east side of the Sacramento Valley and thus the foothills of the Sierra Nevada range.
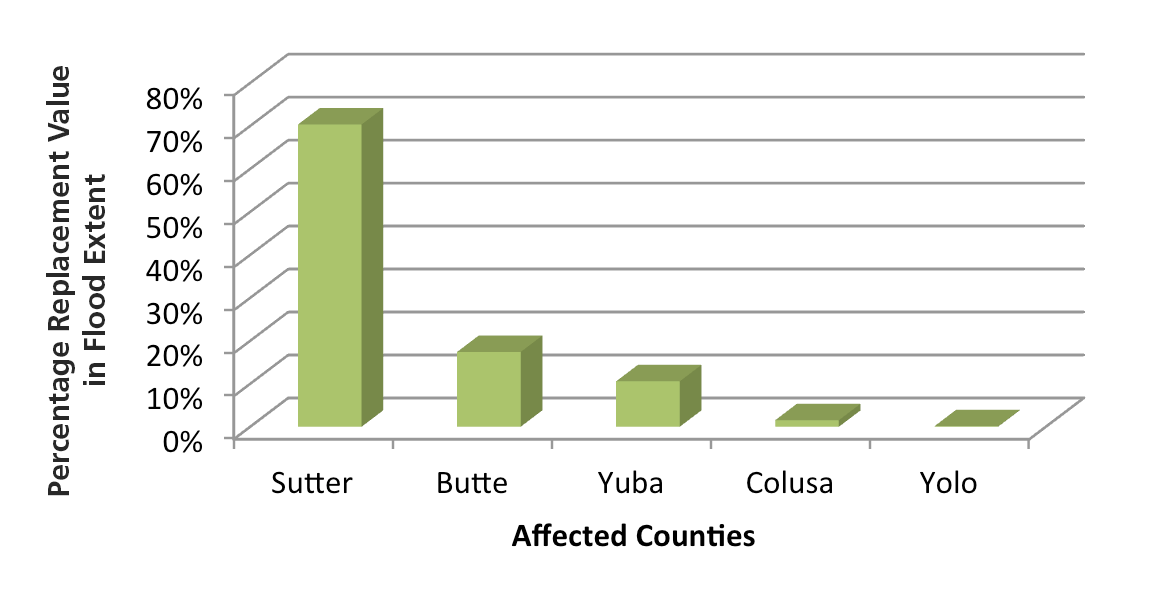
The counties most affected in this scenario are Sutter, Butte, and Yuba (see Figure 4 for the distribution of percentages of exposure value by county). Residential structures account for more than 56% of the total exposure affected, followed by commercial/industrial and auto exposures (see Table 1). The total value of exposure affected in the flood’s footprint is USD 20 billion.
| County | Exposure Value by Line of Business (in USD Millions) | |||||||
|---|---|---|---|---|---|---|---|---|
|
||||||||
| Butte | 160 | 1,560 | 1,850 | 3,570 | ||||
| Colusa | 7 | 260 | 50 | 317 | ||||
| Sutter | 720 | 4,820 | 8,880 | 14,420 | ||||
| Yolo | 2 | 3 | 20 | 25 | ||||
| Yuba | 800 | 1,290 | 800 | 2,170 | ||||
| Total | 969 | 7,933 | 11,600 | 20,502 | ||||
Modeling a Dam’s Failure Risk
Dams (and critical infrastructure, in general) require constant maintenance to perform as originally designed. The United States has more than 85,000 dams, the majority of which are privately owned. Failure of these systems can have a devastating impact to the downstream communities and even result in loss of life. The spillways at the Oroville Dam, will need extensive repairs after the recent incident. Oroville is just one of California’s 1,500 dams, 833 of which are considered by the USACE to have “high hazard potential.” The 2016 update of the National Inventory of Dams indicates that since 1998 the number of dams that have high hazard potential—whose failure would cause loss of life—has increased from 9,281 to 15,498.
The experience at Oroville Dam this past February underscores the importance for companies and governments to be able to answer the following question: If a dam failure occurs, what will the impact be? Although partial or even complete failure of dams is rare, AIR is able to model4 such extreme events to ensure that a wide spectrum of potential scenarios is accurately represented. The first step to understanding the risk of failure is to learn if the dam meets federal or state safety standards. If red flags start appearing as a result of your research, such as a dam being described as having high hazard potential, you may want AIR5 to perform an analysis of the flood risk associated with the failure of the dam. The U.S. will mark National Dam Safety Awareness Day on May 31, but dam failure is a growing risk worldwide.
 Nathaniel Adams, Engineer
 Matthew Hergott,
Engineer
Edited by Sara Gambrill, CCM
1 Berry Creek 7.5’ Quadrangle 1970, Cherokee 7.5’ Quadrangle 1970, Forbestown 7.5’ Quadrangle 1970, and Oroville Dam 7.5’ Quadrangle 1970
3 Almost all the rivers in this area have levees; while it is likely that many of these would fail close to the large floodwave, downstream areas would likely be protected by many of these structures.
4 Losses for this type of scenario can be estimated on a consulting basis. The AIR Inland Flood Model does not explicitly account for damage caused by flooding resulting from catastrophic dam failures in cases in which the primary driver of damage is the momentum of the floodwave rather than flood depth.
5 AIR’s Global Resilience practice provides governments and non-governmental organizations with solutions to help better prepare for and recover from disasters. By leveraging our three decades of catastrophe modeling experience for the public good, we are making society more resilient. AIR can quantify risks to populations, infrastructure (including dams), evaluate mitigation strategies, and review building code improvements.
