


A Year to Remember: The 2017 Atlantic Hurricane Season
Dec 13, 2017
Editor's Note: In this article, AIR Assistant Vice President and Director of Meteorology Dr. Peter Sousounis discusses this year’s notable Atlantic storms and why the peak of the season was so remarkably active.
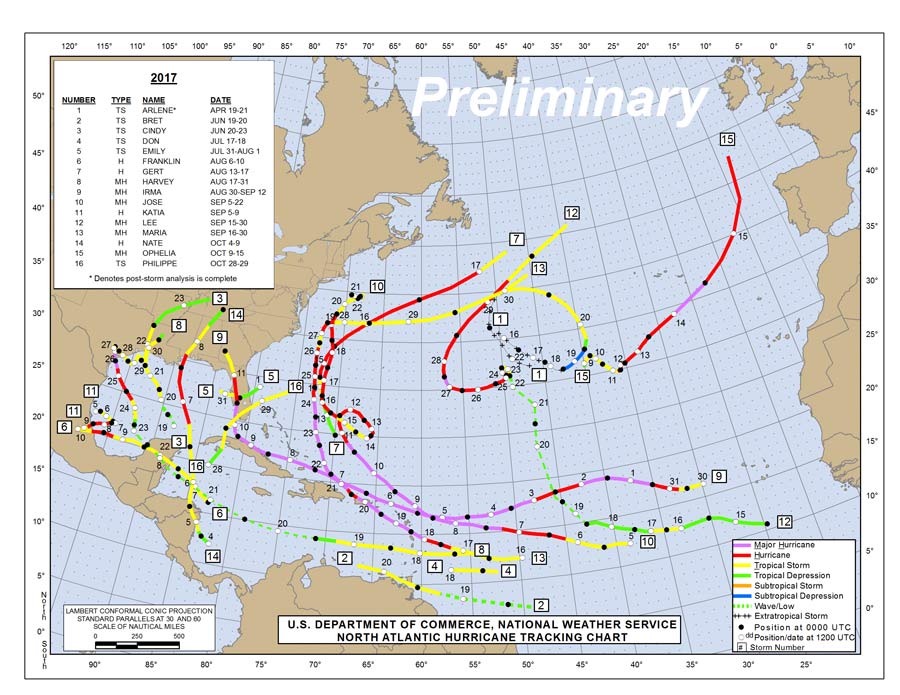
If it hadn’t been for the month of September, 2017’s Atlantic hurricane season would have been remembered principally for the catastrophic devastation from a single major storm in late August—Hurricane Harvey. But this September was the most active month on record, and 2017 ranks as one of the most active seasons known—and probably the costliest.
This year’s season got off to an early start when for the third year in a row, the first storm formed in April; Arlene intensified into a tropical storm on April 20. In June, Bret became the earliest named storm to form in the Atlantic’s Main Development Region. Hurricane Franklin briefly impacted Mexico as a Category 1 storm in early August, but otherwise the season progressed unremarkably. By late in the month the Atlantic had experienced only seven named storms, just two of which (Franklin and Gert) had achieved hurricane status (Categories 1 and 2, respectively).
Activity was ramping up significantly, however, and when Harvey crossed the coast of Texas on August 26 it dramatically ended the drought of U.S. major hurricanes (Category 3 or higher) since Hurricane Wilma struck Florida in October 2005. Harvey delivered more rainfall than any other recorded tropical cyclone in the U.S. or its territories, leading to unprecedented flooding.
 Dr. Peter Sousounis
Assistant Vice President and Director of Meteorology
Edited by Jonathan Kinghorn, CEEM
The article:
- This hurricane season’s combination of low wind shear, tropical moisture, and extremely warm waters had the potential to generate tremendous storm energy.
- 2017 was one of only four Atlantic seasons to have produced 10 hurricanes in a row—half of which occurred in September.
- The ACE score for 2017 is 226, more than double the 1981–2010 full-season median and the highest since 2005.
Activity in the Atlantic calmed significantly in October, although Nate became the fastest moving tropical cyclone ever recorded in the Gulf of Mexico and Ophelia formed farther east than any other known major hurricane. November saw only one tropical storm develop, and it remained mid-ocean.
Seasonal Forecasts
In our season preview we stated that “While the forecasts for 2017 vary in detail, the most recent are in general agreement that the Atlantic is likely to experience slightly above-average activity this year.” Noting the likelihood of mild El Niño conditions, however, we also warned that “unpredictable secondary factors will influence the season’s development.”
According to the National Oceanic and Atmospheric Administration (NOAA), an average season produces 12 named storms, six of which become hurricanes, three of which become major hurricanes. NOAA’s seasonal forecast was issued on May 25, and suggested a 45% chance for an above-normal season, predicting that there was a 70% possibility of having 11 to 17 named storms, five to nine of which could develop into hurricanes, including two to four major hurricanes. What changed?
Tropical cyclone development is fueled by the warm, moist air over the ocean near the equator. The warmer the water, the more energy there is available to drive hurricane formation. This year’s most significant unpredictable secondary factor was that water in the North Atlantic was warmer than usual, with September’s temperatures being the third warmest on record. Only 2005 and 2010 produced higher figures, and both of those years delivered intense hurricane seasons. In 2005, for example, there were four Category 5 hurricanes (Emily, Katrina, Rita, and Wilma—the most intense hurricane recorded to date at the time).
In addition to El Niño/La Niña (ENSO), another climate signal that strongly (and positively) correlates with hurricane activity is the Atlantic Multidecadal Oscillation (AMO) Index. The AMO has been positive since the mid-1990s; however, recently, some have suggested that this phase is reaching its end and is now trending downward—even going so far as to prognosticate a drop to below-normal hurricane activity in the short term. A downward trend was certainly not evident this year, however, and in fact temperatures have a long way to go before they become cooler than the long-term average. Both this year and last year the index has been about as positive as it has ever been and the October value was 0.436—almost a half degree Celsius warmer than normal for the month, and the highest October value on record since 1856! The recent status of the AMO strongly suggests it would therefore be scientifically prudent to expect hurricane activity to remain at normal to above-normal levels over the coming short term—other climate influences aside.
This year’s La Niña-like conditions (which reduce the wind shear that can disrupt hurricane development), coupled with tropical moisture, and warm waters had the potential to generate tremendous storm energy. In response to the developing conditions, NOAA revised its seasonal forecast on August 9, upping its prediction to 14–19 named tropical systems. Their outlook still called for five to nine hurricanes, but increased the predicted range of likely major hurricanes by one (two to five) and warned presciently that "the season has the potential to be extremely active, and could be the most active since 2010."
Hurricane Harvey
The “potential” NOAA cited was realized first in late August with the development of Hurricane Harvey, which fared poorly until it reached the Bay of Campeche on the coast of Mexico. It then intensified rapidly from tropical depression to hurricane status on August 24 and became a Category 4 hurricane the next day. Harvey made landfall in the U.S. on August 26 to become the first U.S. Category 4 hurricane landfall since Charley in 2004 and the first hurricane to strike Texas since 2008.
Winds at landfall were approximately 130 mph, with hurricane-force winds extending 40 miles from the storm’s center; storm surge was estimated at 6 to 12 feet. With no large-scale steering patterns present, Harvey essentially stalled over southeastern Texas for two days at tropical storm-strength, dropping unprecedented amounts of precipitation. Feeder bands continued to bring abundant amounts of moisture from the Gulf of Mexico, with the Houston area being the primary target. By the morning of August 28, a total of 24.44 inches of rain had fallen at Bush International Airport in Houston, where a new daily rainfall record was broken with 16.07 inches falling in one day. Harvey delivered more rain to Texas than any other tropical cyclone recorded in the U.S., causing widespread catastrophic flooding, and spawning several tornadoes around Houston.
Hurricane Irma
Hot on the heels of Harvey came Irma, which made its first landfall on Barbuda on September 6, damaging or destroying 95% of structures on the island. It then battered a string of further Caribbean islands, inflicting catastrophic damage to infrastructure, agriculture, businesses, and homes, before making landfall on Cuba’s northern coast as a Category 5 storm on September 8. Irma weakened to Category 3 as it interacted with land, but re-intensified to a Category 4 storm as it turned north toward Florida.
Hurricane Irma's center made its first U.S. landfall on September 10, striking Cudjoe Key at Category 4 strength, with maximum sustained winds of 130 mph according to the National Hurricane Center (NHC). The islands north of Key West to Marathon suffered the worst damage; at least one quarter of the homes on Key West were destroyed, and 65% suffered major damage, according to official estimates. Irma then weakened to Category 3 status and shifted to the west, sparing Miami the direct hit that had been feared. It made its second landfall on Marco Island and continued moving north, passing over the city of Naples before weakening to a Category 2 as it moved inland, sparing Tampa a direct hit.
On the morning of September 11, Irma—now downgraded to a tropical storm—brought heavy rain to Jacksonville on Florida’s northeast coast. The storm surge prevented water from draining out of the St. John’s River for multiple tidal cycles and caused Jacksonville’s worst flooding in the last 60-plus years. Irma was a record-breaking storm; it sustained winds of 185 mph for 37 hours—longer than any other tropical cyclone in the world has maintained that intensity—and generated a higher ACE score than the season’s first eight named storms combined.
Hurricane Maria
The next damaging hurricane was Maria, which tore through Dominica on September 18 as a Category 5 storm—the island’s first recorded strike by a hurricane this strong. It defoliated nearly all the island’s vegetation, destroyed its agricultural sector, and caused serious damage to much of its building stock.
Maria then cut west-northwest over the Caribbean, thrashing islands that had been left in ruins by Hurricane Irma just two weeks earlier, and razing areas previously unscathed. It made landfall on Puerto Rico on September 20 as the island’s first Category 4 storm in 85 years. Maria’s eye traversed the length of Puerto Rico with its radius of maximum winds closely matching the island’s width. It weakened as it interacted with the mountains but still caused widespread damage to agriculture and buildings recently impacted by Irma, and destroyed the island’s power grid. Maria inundated the country with 12 to 18 inches of rain, with isolated amounts of up to 25 inches, and caused widespread flooding.
Maria next tracked northeast of Hispaniola, bringing damaging winds and flooding rainfall to the Dominican Republic and northern Haiti before turning north, then weakening at an accelerating rate, and passing the Outer Banks of North Carolina on September 26.
Expect the Unexpected
Whichever way you look at it, 2017 was a remarkable hurricane season: the U.S. major hurricane drought ended; it was the first year on record in which the U.S. experienced three Category 4 or higher landfalls; and September was the single most active month on record. There were 17 named storms, 10 hurricanes, and 6 major storms—more hurricanes and major storms than even NOAA’s revised seasonal forecast anticipated. NOAA categorizes 2017 as an above-normal season and currently the year’s ACE score is 226—more than double the 1981–2010 full-season median and the highest since 2005.
And yet 2017 is not the worst hurricane season known; there have been years with more hurricanes and more major hurricanes, with higher ACE scores, and with greater loss of life. We often warn that an active season doesn’t necessarily mean high losses, and that just one storm—even a bypassing one—can cause catastrophic losses. This year has seen catastrophic damage from multiple major storms, some of which made landfall several times, and 2017 could very well end up being the costliest on record.
Further Reading
Harvey
Notes from the AIR Damage Survey Team: Houston, TX
Notes from the AIR Damage Survey Team: Rockport, TX
Potential Supply Chain Disruptions from Hurricane Harvey
Irma
Residential Wind and Surge Damage Inflicted by Hurricane Irma
Notes from the AIR Damage Survey Team: Marco Island, Everglades City, and Goodland, FL
Notes from the AIR Damage Survey Team: Naples and Bonita Springs, FL
