


Building a Bayesian Space- and Climate-Dependent Model of Tropical Cyclone Landfalls (in Plain English)
Mar 15, 2016
Editor's Note: The first part of this two-part series examines the Bayesian statistical paradigm and its relevance to catastrophe risk modeling through allegory and a general explanation. Here, in Part II, Research Scientist Suz Tolwinski-Ward examines a specific use of Bayesian modeling to estimate the annual probability of tropical cyclone landfalls as a function of climate state and location along the coast of North America. Her research is a part of ongoing efforts at AIR to study the impact of climate on catastrophe risk and to develop more physical modeling approaches.
In an earlier article, the career arc of a Martian scientist studying tropical cyclones on Earth shed light on how Bayesian statistical modeling can assimilate both scientific expertise and data, even in the presence of numerous sources of uncertainty. Here at AIR, such approaches play an integral role in the efforts of this Earthling's research on tropical cyclone activity in the Atlantic Basin. In a recent peer-reviewed study, we developed a Bayesian hierarchical model to quantify the relationship between three climate signals and tropical cyclone (TC) landfall frequency along the North American coastline. We also probed the fitted model to explore the extent to which various uncertainties in the data limit the inferences we can draw.
The Prior Model
The first step in developing the model was to develop a probabilistic prior for TC landfalls. As the reader will remember from Part I of this series, a prior model describes our broad-brush beliefs about the process of interest before any historical data has been brought to bear. So in this particular case, prior modeling provides the mathematical structure to describe landfall frequency along the North American coastline in any given year without making use of any data about historical landfalls or ascribing numerical values.
Our probabilistic prior describes landfalls as discrete counts, such that any integer number of landfalls, from zero to an arbitrarily large count, could be observed in any of the 50-nautical-mile linear segments approximating the coastline. The structure of our model also builds in "Tobler's First Law of Geography," that the probability of landfalls in coastal regions close together in space should be similar, while greater spatial separation leads to less tightly coupled probabilities. We also include a component that accounts for the effect of coastline geography. Even coastal segments that are close together in physical space are not constrained to have similar probabilities of landfall if they are oriented at very different angles. For example, Daytona Beach, on the Atlantic Coast of Florida, is not bound to have similar TC landfall probabilities as the city of Crystal River—just a short distance away as the crow flies, but on the Gulf side of the Sunshine State.
 By: Susan Tolwinski-Ward
Ph.D. Scientist
Edited by Nan Ma
The article:
- AIR used Bayesian statistical approaches to develop the first explicitly spatial model that quantifies the impact of climate on annual tropical cyclone landfall frequency.
- The model includes the effect on landfall frequency of the phases of three climate signals—ENSO, AMO, and NAO.
- Uncertainty from many sources is modeled—including uncertainty in the parameters, sampling variability in the short historical record, and positional uncertainty in landfall location in the HURDAT2 database.
In addition to these spatial linkages, our prior model also describes a mathematical form for the influence that three modes of large-scale climatic variability can have on TC landfall frequency. The first of these modes is a combination of two climatic phenomena: El Niño and the Southern Oscillation (ENSO). Although defined by variations in sea surface temperature and wind patterns in the equatorial Pacific Ocean, it is well known that ENSO can have strong impacts on remote weather patterns. Over the Atlantic Basin, strong El Niño events tend to produce stronger-than-average wind shear, which in turn is known to inhibit the formation and strengthening of TCs. On the other side of the continuum, a reduction in wind shear over the Atlantic tends to accompany La Niña events, and so hurricane seasons that occur during the La Niña phase of ENSO are associated with higher-than-average hurricane activity. Because ENSO can alternately dial up or down the overall count of TCs in the basin that may be considered candidates for landfall, our model includes a term that dials landfall probabilities either up or down across space depending on the phase of this oscillation. The sensitivity of this "dial" is left unspecified at the prior modeling stage so it can later be calibrated by inference from the data.
Similarly, sea surface temperatures across the entire Atlantic Basin can increase or decrease the number of storms that could potentially make landfall, given that warm ocean water is one of the key ingredients needed for TC formation. A measure of the climatic mode called the Atlantic Multidecadal Oscillation (AMO) indicates whether temperatures across the basin are above or below average. We add another "dial" to our prior model to increase or decrease overall landfall frequency based on the state of the AMO.
Finally, we account for the North Atlantic Oscillation (NAO). Depending on the phase of the NAO, the zone of high pressure known as the Bermuda High shifts location. In contrast to the previous two climatic variations, this movement of the Bermuda High does not enhance or inhibit TC formation, but influences the large-scale flow of the atmosphere and thus the most likely regions of coastline to which winds may steer TCs. Thus in the case of the NAO, the "dial" we add to the model has the flexibility to vary along the coast so it will be able to capture regional responses if these show up in the data.
The Data-Level Model
The second stage of modeling is to create a data-level model, which describes our confidence in the data themselves, given what we know about how they were collected. The data used in our study comes from the freely available HURDAT2 database1, 2, compiled and maintained by scientists at the National Hurricane Center. For landfalls along the coastal United States and Canada, we use data collected up to the present and starting in the year 1900, widely cited as the first year during which we can assume there is no undercounting of landfalls. Because there has historically been less observing infrastructure in Mexico and Central America, we use data starting in 1950 for these regions. We explicitly model time-varying uncertainty in the recorded position of landfalls to reflect the technological improvements in observing platforms over time. For example, the accuracy of the recorded landfall location jumps with the introduction of aircraft reconnaissance flights in 1944, and again at the beginning of the satellite data era in the 1970s.
Addressing Uncertainty
Bayes' Law provides the formalism for molding the constraints provided by the scientifically motivated prior model to fit the data. Where the data-level model describes the observations as less certain, the formalism produces results that stay more closely aligned to the prior model description. Meanwhile, highly certain observations can override parts of the prior model that seem incompatible or inconsistent with those data.
The animation below provides a visual representation of the estimated landfall probabilities that come out of the model as a function of space and climate. The very first frame shows the central estimate of the probabilities for neutral climate conditions—that is, average ENSO, AMO, and NAO conditions. It is no surprise that these estimates look like a smoothed version of the historical observations. The animation then shows how the spatial probabilities change as each of the phases of the climate variables is dialed up and down, and then for any combination of the three.
[Please check your browser settings if the animation is not playing.]
While estimated effects of climatic modulation on landfall probabilities conform to our expectations based on physical understanding of the climate system, we have not imposed these effects on the model. Rather, the data have determined the direction, spatial pattern, and magnitude of the landfall probability response to these climate configurations through the process of Bayesian inference.
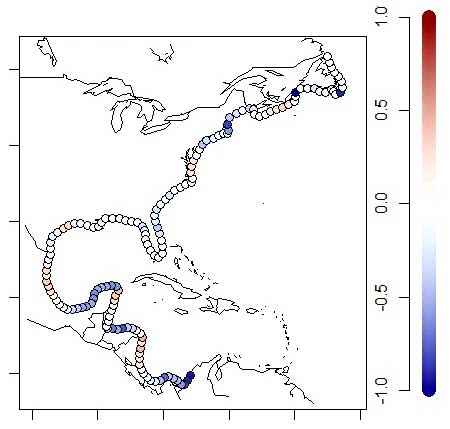
Visualization of just the central estimate of landfall probabilities as a function of space and climate is complex enough that it requires animation, but the product of the analysis provides much more information. In particular, the output of the Bayesian model is a full probability distribution, so uncertainty on all the parameters is represented as well. For example, dialing up the phase of the NAO on average over the course of a hurricane season tends to move the Bermuda High to a position that decreases the probability of landfalls along coastal Florida relative to seasons with low NAO phase (see Figure 1). However, the result is subtle, and an effect of zero influence due to varying NAO is still well within pointwise 95% credible intervals for the effect along the coast.
Various experiments in fitting the model also help sort the relative importance of various sources of uncertainty in the inputs. In one experiment, we ignored the positional uncertainty in the HURDAT data, in effect pretending that the data represented errorless observations. This experiment narrowed the uncertainty around the landfall probability estimates along the coast slightly, and changed the central estimate of frequencies by only a surprisingly small amount. Those results show that the ambiguity in the historical data actually matter relatively little in estimating landfall frequencies at the fine, 50-nautical-mile coastline resolution used in our model.
An experiment in which we fit the model first with data from even years only, and then with data from odd years only, had more striking results. The difference in the resulting estimated pattern of landfall probabilities as compared to using all historical years is appreciable to the eye, with large differences near Boston, for example (see Figure 2). These results suggest that the 114-year data interval used in the study is not long enough to overcome the sampling variability in Mother Nature's underlying landfall distribution. In other words, even if the implicit modeling assumption that the historical TCs were drawn from a stationary distribution were true, the number of TCs that fell along any part of the coast would likely be different were it possible to repeat Earth's history from 1900-2013 with slightly perturbed conditions. Of course, the combined influence of sampling variability and the brevity of the historical record is old news and is, in fact, the reason catastrophe risk models are needed in the first place for a comprehensive view of risk.
Models of the Future
One major takeaway from this last result is the importance of uncertainty modeling in this particular context. While 114 historical years of data cannot stably resolve the frequency of landfall hazard over the fine, 50-nautical mile coastline segments, modeling at these scales is paramount for representing the property at risk. Representing the full range of possible hazard configurations across space through an enhanced specification of TC landfall uncertainty will allow a more complete view of risk to (re)insurers' portfolios and individuals' properties in the models of the future.
This AIR Currents article is the plain-English version of a recent peer-reviewed study, published in the Journal of Advances in Modeling Earth Systems (which can be read in full technical detail at this link).
References
1 Jarvinen, Neuman, and Davis (1984), A tropical cyclone data tape for the north Atlantic basin, 1886-1983: Contents, limitations and uses, NOAA Tech. Memo. NWS NHC-22, 21 pp. Natl. Oceanic and Atmos. Admin., Washington, D.C. [Available at http://www.nhc.noaa.gov/pdf/NWS-NHC-1988-22.pdf]
2 Landsea and Franklin (2013). Atlantic hurricane database uncertainty and presentation of a new database format, Mon. Weather Rev., 141, 3576-3592, doi:10.1175/MWR-D-12-00254.1.
