


Modeling Fundamentals: Uncertainty Options in Software
Jul 22, 2015
Editor's Note: This article outlines some ways in which users of AIR's Touchstone platform can gain new insights into the uncertainty in their modeled loss estimates, create a framework for testing the sensitivity of results, and make better informed business decisions.
Uncertainty in catastrophe modeling often falls into two broad classifications: primary and secondary. Primary uncertainty can be defined as uncertainty as to the size or intensity of future events and when and where they will occur. It is captured in the process of generating the model's stochastic catalog. Secondary uncertainty is the uncertainty in aspects of the model once an event is defined, including how the intensity propagates to individual sites, building response, damage estimation, and exposure information.
In Touchstone®, secondary uncertainty is considered by default and propagated through each step of the loss calculation within the financial module, regardless of the analysis options chosen. Taking the example of a single risk (building) and a single event, once the mean damage ratio is estimated, a distribution around this mean is populated. The choice and shape of distribution depends on the region, the peril, the mean damage ratio, and the characteristics of the building. Engineered structures, for example, will have different damage distributions than non-engineered structures; flood will produce different damage distributions than tornado. Next, the damage distribution is multiplied by the risk's replacement value to yield the loss distribution, and, if appropriate, demand surge is applied. The resulting distribution shows ground-up loss for a given coverage/location/event combination. When location-level and policy-level terms and conditions are applied, they are applied to the entire distribution of potential loss.
When distributions of loss are combined across coverages, locations, and even contracts, the full distribution of potential loss for the single building is maintained until a final loss estimate for an event is reached. While users can't see the whole distribution for a given event directly within the software, they can get summary statistics such as the mean, standard deviation, and maximum estimated loss. In addition, there are features and analysis options within Touchstone that can help users more realistically reflect and better understand the uncertainty in their loss results.
 By: Joe Cleveland
Senior Manager, Training and Education
Edited by Jonathan Kinghorn
The article: - To get the most out of catastrophe models, a firm understanding of the sources and magnitude of uncertainty is essential.
- In Touchstone, secondary uncertainty is included and propagated through each step of the loss calculation, regardless of the analysis options chosen.
- Additional features in Touchstone, including Uncertainty Bands and EP Curve with Secondary Uncertainty, can help users better understand uncertainty in loss results.
Uncertainty Bands
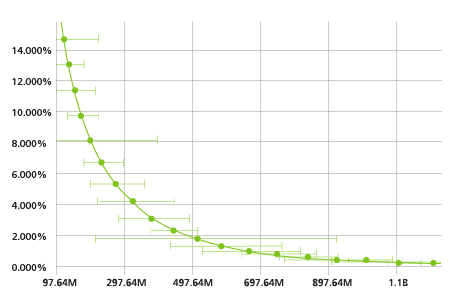
The Uncertainty Bands featured in Touchstone allow users to specify two percentiles to create a confidence interval around a loss distribution, with the results displayed for each event in the Annual EP Chart (occurrence or aggregate) and stored in the Touchstone results database. For example, a user could specify the 5th and 95th percentiles to give a sense of both the expected losses and the range of uncertainty. Or, by taking the 75th or 90th percentile loss for each event, a user could take a more conservative perspective on a given account or portfolio's potential losses—especially for high-value portfolios containing only a few risks.
Figure 1 shows the loss percentiles as they are displayed on the Annual EP Chart in Touchstone.
EP Curve with Secondary Uncertainty
The second feature we'll discuss in this article is the EP Curve with Secondary Uncertainty (EPSU). The EPSU gives users an alternative view of the EP curve, one that considers not just mean losses but the entire distribution of secondary uncertainty for each event or simulation year as propagated through the full loss calculation.
To illustrate the difference between the Standard EP and the EPSU, let's take a simple example where we wish to find the exceedance probability of a USD 75 million loss from a 10,000-year simulation. For the standard EP curve, we would compute mean loss for each year in the catalog, and then count the number of years with losses > USD 75 million:
Total Probability (Loss > USD 75 million) = number of years with loss > USD 75 million/10,000
To do the same calculation for the EPSU, we would have to calculate the probability that each year's loss is greater than USD 75 million before adding the probabilities together:
Total Probability (Loss > USD 75 million) = Probability (Year 1 Loss > USD 75 million) × 1/10,000 + Probability (Year 2 Loss > USD 75 million) × 1/10,000 + … + Probability (Year 10,000 Loss > USD 75 million) × 1/10,000
To calculate the EPSU, we start by taking the mean, standard deviation, and maximum loss for each of the largest event losses (in the case of an occurrence curve) or the sum of all losses (for an aggregate EP curve) for each simulation year. Using the full distribution for each year, the probability of various levels of loss are binned and accumulated across the entire catalog. To achieve greater precision, this process is dynamic in that there are more granular bins for loss levels that have a higher probability of occurrence for a given event or year. Finally, this aggregated distribution is normalized to the catalog size, and the losses for each standard exceedance probability are interpolated from it, creating an EP curve that is directly comparable to the standard EP curve but built from more information. Figure 2 shows an example of the two curves side by side in Touchstone.
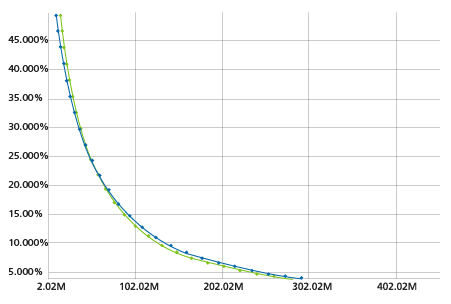
EPSU can be toggled on or off with any Touchstone detailed loss analysis. Results are likely to differ from the standard EP curve, with typical behavior showing the two curves crossing at some point. Generally speaking, for higher exceedance probabilities, the losses will be higher on the standard EP curve than the EPSU, whereas at lower exceedance probabilities, the EPSU will tend to have higher losses. This phenomenon is a result of the way the EPSU is built—for the smaller losses, the EPSU is more likely to be sampling probabilities of loss from the left tails of the event/annual distributions, or outcomes, which are smaller than the mean losses used to create the standard EP curve. However, the further out you move into the far right tail of the EPSU, the greater the probability will be that losses will be higher than the mean, creating the opposite effect.
One drawback to focusing exclusively on the EPSU is the fact that you can no longer tie the loss at a specific exceedance probability back to any one year or event. This is because the exceedance probabilities are based on losses aggregated across events and years. The inability to associate losses at various EPs to specific events can, however, be useful in calculating contribution to TVaR or similar risk measures. The EPSU is best used in tandem with the standard EP curve as it provides an alternative view of risk and more insight into the uncertainty in a set of loss results.
Conclusion
Uncertainty is involved in every step of catastrophe modeling, from data capture to communication of results. To get the most out of the models, a firm understanding of both the sources and magnitude of uncertainty is essential. The employment of best practices at each stage of the modeling workflow can expose and isolate sources of uncertainty and enable good judgment about how to use results.
In the coming months and years, AIR will continue to add new functionality and metrics to Touchstone as part of our "next generation financial module" to help modelers enhance their understanding of the uncertainty in their portfolios and loss estimates. By using the tools discussed here, users can gain new insights into their books of business, create a framework for sensitivity testing results, and make better informed business decisions.
