


Where Does the Water Go?
Aug 28, 2014
Editor's Note: Learn how AIR flood engineers determine where floodwaters travel on the vast floodplains of the United States and the severity of flooding at each location. To learn more about the AIR Inland Flood Model for the U.S., please read the AIR Currents articles "Introducing the AIR Inland Flood Model for the United States" and "Defining a Flood Event in the United States."
Only a few inches of water in basements and ground floors can cause extensive loss to contents and building components. In homes and businesses, basements often house utilities such as electrical equipment, water tanks and boilers, and air conditioning systems—all of which can be costly to repair or replace. And while it is uncommon for flooding to cause structural building damage, replacement of damaged drywalls, insulation, and flooring, as well as treatment for mold and bacterial growth, can add up to high losses.
From Rainfall to Rivers
Modeling inland flood begins the same way an actual inland flood does—with precipitation. Capturing the effects of variable atmospheric conditions, patterns of rainfall and snowmelt, water storage (lakes, ponds, and reservoirs), land usage, soil type, and other local factors, a hydrological model determines the flow and routing of water along a river.
The volume rate of water flow, called river discharge, is calculated at each river segment on an hourly basis, which ensures that peak flows that cause the water to rise above the river banks are captured. (For off-floodplain locations, a different factor—surface runoff—is used instead of river discharge and the hazard is calculated using a statistical method.) To learn more about the hydrological model and how AIR defines a flood event, please read the previous AIR Currents article "Defining a Flood Event in the United States."
From Rivers to Floodplains
To translate river discharge into flood depth, an effective inland flood model needs to account for the huge diversity of terrain in the U.S., from short East Coast rivers to the mighty Mississippi and desert plains to canyons in the Cascades.
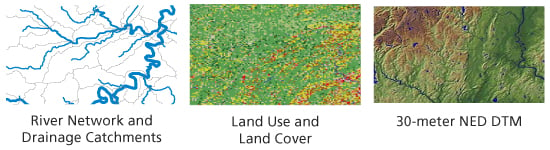
Information on the country's vast river network, land use/land cover data, and a detailed digital terrain model (DTM) are essential in calculating how the water spreads on the floodplain once it leaves the riverbanks. Topography, surface roughness, and flood defenses, and a multitude of other factors influence where the water ends up and what the depth of the water is at each location.
 By: Nalan Senol Cabi
Hydraulic Engineer
Edited by Eric Bland
Highlights:
- Local flood intensity (measured as water depth) depends on storm intensity, topography, land use/land cover, local geological conditions, soil saturation, among many other factors
- AIR's inland flood model for the U.S. uses an innovative 2D mapping approach to capture realistic flood footprints, while maintaining computational efficiency
- Approach allows for a fully probabilistic view of risk, unlike traditional flood hazard maps
- The model accounts for flood defense failures probabilistically.
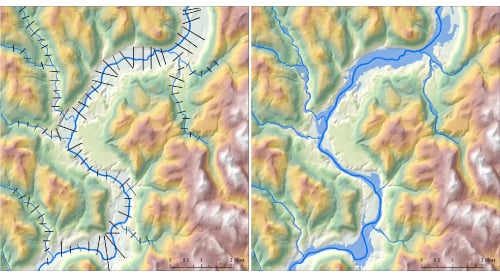
AIR begins with a one-dimensional (1D) hydraulic model to calculate water elevation at river cross sections (spaced at approximately every 500 m) for each level of river discharge (see text box on Rating Curves). The methodology is based on the well-established Hydrologic Engineering Centers River Analysis System (HEC-RAS) from the U.S. Army Corps of Engineers (USACE). HEC-RAS can also be used to calculate how far waters extend into the floodplain along each cross section of the river. However, flood mapping with HEC-RAS can create artificial boundaries on wide flat floodplains because the flood extent is limited by the physical length of each cross section.
To calculate more realistic flood footprints, AIR developed an innovative flood mapping tool that calculates the spread of water in two dimensions. This flood mapping tool solves kinematic and diffusive wave equations that govern the movement of water over the digital terrain model (DTM), capturing complex floodplain geometries and realistic flow patterns that a 1D model is not always able to. The result is a continuous water surface that delineates the entire flood extent across the floodplain. Location-level flood depth is calculated by subtracting the elevation of the ground (as determined from the DTM) from the elevation of the water surface. AIR's combined 1D hydraulic modeling and 2D flood mapping methodology requires less computational time than a purely 2D model, while providing a highly realistic view of flood hazard.1
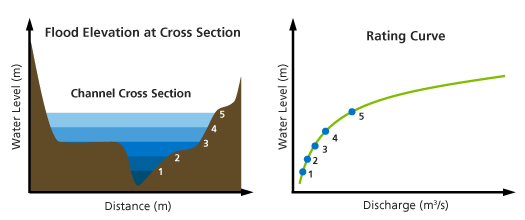
Rating Curves
The relationship between discharge and water surface elevation at a river cross section is known as a rating curve. The AIR inland flood model precalculates rating curves for flood extents with return periods ranging from two to 10,000 years. The rating curve for each point of interest is saved and can be referenced "on the fly," which is one reason a book of business with millions of locations can be modeled against 10,000 years of storm activity across the entire model domain in a computationally efficient manner.
The Destination: A Fully Probabilistic View
For years, flood hazard maps known as Flood Insurance Rate Maps (FIRMs) have been used in underwriting and pricing flood insurance policies in the United States. These maps, developed by the Federal Emergency Management Agency (FEMA), display areas that fall within the 100- and 500-year return period (1% and 0.2% exceedance probability) floodplains.
While widely used, flood hazard maps like FIRMs have disadvantages, many of which have contributed to the limited availability of private flood insurance in the U.S. They do not capture inundation depth and do not cover the entire country. An exposure is either classified as being in a flood zone or not, which does not allow for granular risk differentiation between properties.
FIRMs also do not provide a means to assess flood risk for properties protected by levees. The U.S. has thousands of miles of levees, which vary widely in age and condition. Levee failure is very possible and must be considered to provide a realistic view of risk.
Perhaps most significantly, FIRMs cannot be used in fully probabilistic assessment of risk, which is standard practice with other catastrophic perils such as hurricane, earthquake, and severe thunderstorm. Instead, they show areas of uniform hazard assuming that every river segment experiences the same return period flow, at limited and discrete return periods. As such, they do not represent potential flood events because all river segments will not experience the same return period flow during an actual event.
The AIR inland flood model is event-based and fully probabilistic. Simply put, this means that it realistically captures "where the water goes"—from precipitation to the river networks to the floodplain, where individual properties are at risk
Inland flood is a pervasive and perennial risk in the U.S. Knowing where the water goes enables not only a significantly improved estimation of building-specific risk for underwriting, pricing, and accumulation management, but also the assessment of portfolio risk across any geographic extent.
1 A more detailed explanation of this methodology can be found here.
