


The Next Megadisaster: U.S. Severe Thunderstorm Outbreak
Jun 23, 2014
Event: Severe thunderstorm
Model: AIR Severe Thunderstorm Model for the United States
Stochastic Year ID: 715085, Touchstone® V2.0
Affected area: South, Southeast, and Midwest U.S.
Estimated insured loss: USD 13 billion
Annual loss exceedance probability ~1% (100-year return period)
Event Overview
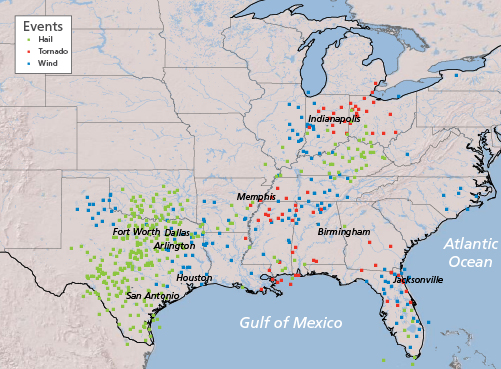
It is early spring when a frontal system brings cool air from the Rocky Mountains across the Southern Plains. When this cold front collides with the warm, humid air ahead of it, drawn northward from the Gulf of Mexico, it produces a severe thunderstorm outbreak that lasts eight days, traveling from Texas up to Michigan.
Wind-driven hail up to 5.25 inches batters much of Texas and part of Alabama. A total of seventy-four tornadoes touch down during the outbreak—in Louisiana, Alabama, Mississippi, Georgia, and Florida up to Arkansas and then into Indiana, Ohio, and Michigan. One-hundred and fifty-seven straight-line wind events result also, but the majority of losses come from hail damage.
AIR estimates that if such an event were actually to happen today, insured losses would reach USD 13 billion across 18 states. Figure 1 shows hail and wind events and tornado touchdowns for this simulated event.

The United States Severe Thunderstorm Setting and History
An estimated 100,000 thunderstorms occur annually in the United States; however, only a small proportion meet the National Weather Service's definition of a severe thunderstorm, which is one that produces at least one tornado, straight-line winds of at least 58 mph, and/or hail measuring a minimum of 1 inch in diameter. While thunderstorms can occur virtually anywhere in the U.S., severe activity is particularly common in the Great Plains, Midwest, and Southeast. From September through April, severe thunderstorms are seen most frequently from eastern Texas to the southeastern U.S. Activity shifts northward from May through August, when storms are most common from the upper Mississippi to Ohio River valleys and from the mid-Mississippi River Valley to the Southern Plains.
On an average annual basis, hail is the sub-peril that causes the highest losses to property, up to several billion dollars each year. Significant property damage usually occurs when hailstones are golf ball-size (1.75 inches in diameter) and larger. The sub-peril with the highest annual occurrence rate is straight-line wind, while the least common is tornado, with approximately 1,200 tornadoes occurring each year. Due to its geography, the U.S. has the most tornado development of any country. Losses from individual severe thunderstorms in the U.S. are generally not as great as those from individual hurricanes or earthquakes, but the annual aggregate losses from severe thunderstorms have accounted for approximately one half of all U.S. catastrophic insured losses since 1990, according to Property Claim Services® (PCS®).
The 1995 Mayfest storm was one of the costliest hailstorms ever at the time. On the evening of May 5, 1995, a supercell struck the Dallas-Fort Worth, Texas, area, producing grapefruit-size hailstones, damaging winds, and heavy rains as it passed over Tarrant County. The hail swath included the bank of the Trinity River where Mayfest, an annual outdoor festival in Fort Worth, was in progress. As the storms moved eastward, the supercell merged with a squall line to produce heavy downpours and flash flooding over eastern Tarrant County and much of Dallas County. In northern Dallas County, rainfall rates approached 23 cm/hr. More than 350 cars sustained weather-related damage, including hail and water damage. Hail impacts also damaged the sidings, windows, and roofs of hundreds of homes and businesses. Strong winds ripped roofs off buildings, causing many to collapse. In Tarrant County, over 50,000 homes were left without power.
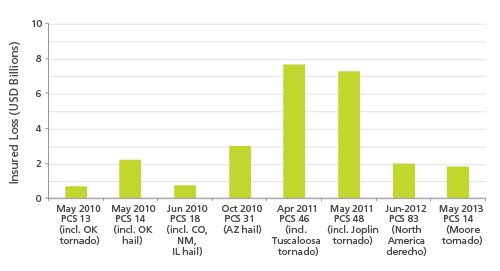
More recently, in late April 2011, the severe thunderstorm outbreak that included the Tuscaloosa tornado caused insured losses estimated at USD 7.3 billion, and the severe thunderstorm outbreak, including the Joplin tornado, in late May caused insured losses estimated to be USD 6.9 billion—two of the costliest severe thunderstorm outbreaks in U.S. history. And just last year, a tornado touched down five miles south of Newcastle, Oklahoma, on May 20, striking the Oklahoma City suburb of Moore five minutes later at EF-5 intensity. The larger storm system of which the Moore tornado was a part caused USD 1.78 billion in insured losses, USD 1.11 billion of them in Oklahoma alone (see Figure 2).
Affected Exposure
Texas, the worst affected state in this Megadisaster scenario, is the second most populated U.S. state after California. The four counties where the hailstorms cause the most insured loss in this scenario are part of the Dallas-Fort Worth-Arlington metroplex—the largest metropolitan area in Texas and the fourth largest in the U.S. The four counties have a population of nearly 6 million.
Hail causes damage mainly to roofs, windows, and siding, and is sometimes followed by damage to contents caused by water entering through openings made by hail. Common materials used to make roofs in this area are asphalt, metal, tile (clay or concrete), and wood. Hail can also cause moderate to heavy damage to automobiles.
Residential houses in the affected areas are typically of wood frame construction; this, and the fact that residential construction is usually non-engineered, make them more vulnerable to high tornado winds and wind-borne debris. Commercial buildings are, on average, less vulnerable than residential structures or automobiles, but can exhibit widespread roof and cladding damage, which also leads to water damage due to rain leaking through cracks and punctures on building envelopes.
Estimating the Impact
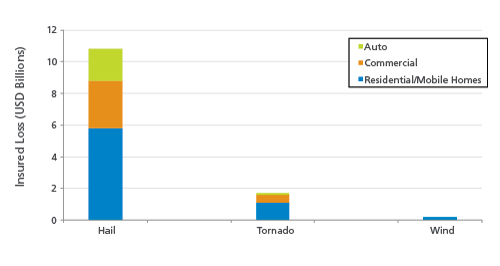
AIR estimates that the simulated event featured here would cause insured losses of USD 13 billion. Figure 3 shows the distribution of loss by county. Texas suffers the majority of losses (85%)—with Alabama and Tennessee representing a distant second (9.2%) and third (2.3%), respectively.
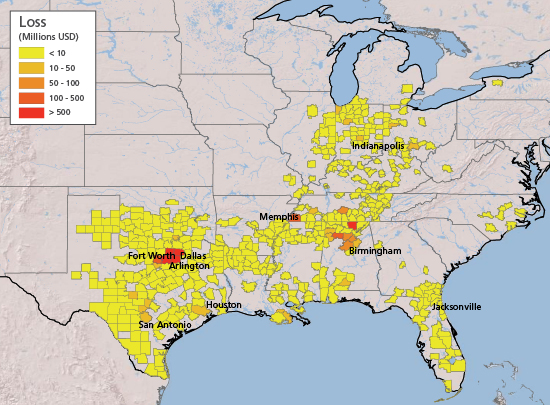
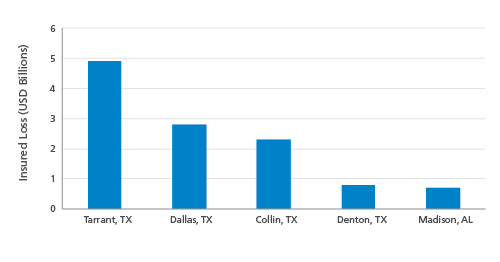
Four northern Texas counties—Tarrant, Dallas, Collin, and Denton—which comprise Fort Worth, Dallas, and suburbs of Dallas, and one county in northern Alabama, Madison County, which contains Huntsville, are hardest hit (see Figure 4).
Hail is by far the biggest driver of insured loss, at 85% (see Figure 5). Losses at the lower end of the exceedance probability curve for severe thunderstorm tend to be driven by hail—however, this does vary regionally and by line of business. Tornadoes cause 13% of insured losses, and straight-line wind 1.5%. Very large hail up to 5.25 inches in diameter causes extensive damage to some roof coverings. Roofs made of asphalt shingles exhibit damage from fractures, punctures, or spalling, which is the chipping, fragmenting, or flaking of the roofing material. Damage occurs primarily on a roof's windward side where hail has the most direct impact, and older asphalt roofs sustain more damage than newer ones. Age is less of a factor for tile roofs, but the windward side also exhibits more damage than the leeward side. Metal roofs sustain moderate to severe denting but no fracturing or puncturing. And cedar shingle roofs show fractures and punctures, allowing precipitation to enter. Older cedar roofs sustain more damage than newer ones.
Hailstorms associated with this severe thunderstorm system also damage the siding of homes and commercial property, and break window glass, giving another port of entry for water damage to the interiors of buildings and their contents.
Hail in this area also damages numerous automobiles by breaking their windshields and denting their exteriors. High wind, large hail, and tornadoes cause locally severe damage in scattered areas across the rest of the affected states. Much of the damage outside of the top five counties occurs in smaller towns and rural areas.
Using model scenarios to probe your portfolio's strengths and weaknesses is responsible risk management practice. It is important to prepare for a wide range of scenarios to respond effectively when disaster does strike. This scenario is just one example of the extensive and widespread damage a severe thunderstorm could produce in the U.S. and in the Dallas-Fort Worth area. Note that countless other scenarios could produce a similar level of loss, and while losses from hail dominated in this example, different breakdowns of losses by sub-peril are possible. The insured loss for this event has a modeled annual exceedance probability of about 1%. This is not an extreme tail event; far greater losses are possible (see Extreme Disaster Scenarios box).
A few modeling best practices can help ensure that your model produces the most realistic loss estimates:
- Severe thunderstorm is a highly localized peril, so getting accurate exposure data—while challenging—is of utmost importance. Collect detailed information for the properties that make up your portfolio—including location and all primary building characteristics such as construction type, occupancy, building age, and height—and a true replacement value. Secondary features will help refine the loss results and help you get closer to the true vulnerability of the individual buildings.
- Roof response to hail is dependent on secondary features, such as roof age, pitch, covering, and attached structures. Roof coverings can also be classed by their hail impact resistance. Other secondary building features that affect a building's vulnerability to hail are: glass type and percentage for windows and window protection as well as wall siding type.
- Touchstone V2.0 can estimate losses separately for each of the three sub-perils of severe thunderstorm (hail, tornado, and straight-line winds). (Note that AIR's software does not allow "double counting"—attributing the same damage to more than one sub-peril—so users can never arrive at a total mean damage ratio that exceeds 100% for a given event.)
- Consider the potential for business interruption losses. Clients can use the AIR model to calculate business interruption as a function of downtime, the level of damage sustained, the size of the building, and its architectural complexity.
- Consider the potential for increased losses due to demand surge. While not included in this scenario, AIR's model can be used to calculate the additional losses due to demand surge as a function of the total industry loss for each event.
- Be aware of potential losses from non-modeled sources such as extreme flooding during some thunderstorm events, fire following, and hazardous material leakage and associated cleanup costs.
- Note that losses to crops caused by hail are not included, but they can be modeled using the AIR Crop Hail Model for the U.S.
- Finally, consider your loss ratio, or how your estimated losses compare to the "total insured value" in each affected area. While your losses may at first appear to be high, the loss ratio they reflect (even in the most severely affected region of this Megadisaster analysis, the loss ratio is less than 5%) should be entirely consistent with an infrequent but thoroughly plausible catastrophic event.
Closing Comments
What will be the next megadisaster surprise?
AIR models capture the behavior of physical phenomena and how those phenomena impact the built environment. They have been thoroughly validated using data from a wide variety of sources.
But no model can predict what the next megadisaster will actually be or when it will occur. The fundamental uncertainty makes it all the more important for companies to use catastrophe models to prepare for such losses. The full range of scenarios the models generate—simulating so many perils that impact so many places—provide a unique and important global perspective on an organization's overall risk. The careful analysis of model results can help risk managers prepare for many contingencies—thus ensuring that scenarios like the one presented here will not be entirely unexpected.
