


The Loma Prieta Earthquake, 25 Years Later
Oct 17, 2014
Editor's Note: This year is the 25th anniversary of the October 17, 1989, Loma Prieta earthquake. To mark this event, the article below is an updated version of our in-depth 20th anniversary retrospective published five years ago. For a discussion on the state of the insurance market in California and the implications of the wide shortfall in coverage, please see this article.
The World Series Earthquake
At 5:04 p.m. on October 17, 1989, minutes before the scheduled start of the third game of the World Series, a strong earthquake struck the Bay Area. Millions of television viewers around the world watched as the earthquake and its aftermath unfolded in real time. Remarkably, no one was injured at San Francisco's Candlestick Park that evening, and the mostly local fans of the two Bay Area contending teams, who in customary California fashion pride themselves on remaining unfazed by earthquakes, erupted into cheers and applause. Unbeknownst to them, the situation was quite different elsewhere.
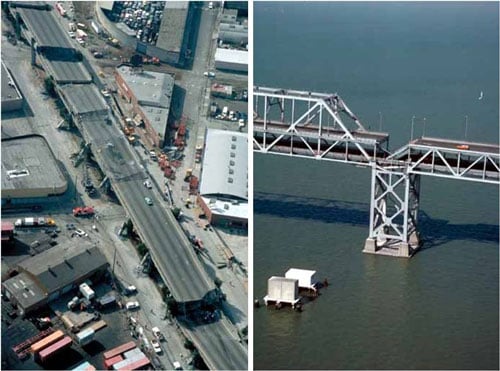
Across the Bay in Oakland, the upper deck portion of a stretch of Interstate 880 known as the Cypress Viaduct fell onto the lower deck, crushing cars below. A 50-ft span of the San Francisco-Oakland Bay Bridge collapsed, closing for a month a crucial transportation link between San Francisco and the East Bay, which served over 300,000 commuters every day. In San Francisco's Marina District, about 50 miles from the epicenter, seven wood-frame buildings collapsed and more than 60 others were too damaged to reoccupy.
Farther south, closer to the earthquake's epicenter, damage was more concentrated. In Santa Cruz, the historic city center, including the Pacific Garden Mall, was devastated and hundreds of businesses were affected. In towns such as Hollister, Watsonville, and Los Gatos, weak masonry buildings suffered widespread damage ranging from cracked walls and fallen facades to complete collapse, and many homes were thrown off their foundations.
In total, the Loma Prieta earthquake was responsible for 63 deaths, 42 from the Cypress Viaduct collapse alone, and over 3,000 injuries. More than 1,300 commercial and residential buildings were destroyed, and another 20,000 damaged to some degree. More than 16,000 housing units were rendered uninhabitable in 10 Bay Area counties, leaving thousands of people homeless. In addition, transportation links (bridges and freeways in particular), communications systems, and utilities were severely disrupted. Direct damage estimated by various organizations ranged between USD 6 billion to USD 12 billion in 1989 dollars.
 By: Mehrdad Mahdyiar, Ph.D.
Vice President and Senior Director, Earthquake Hazard
 By: Nan Ma, CCM
Managing Editor
Edited by Sara Gambrill
Article Highlights:
- Loma Prieta's unusual mid-segment rupture produced an earthquake of shorter duration than a typical Bay Area earthquake of the same magnitude.
- The Loma Prieta earthquake confirmed concerns about the Bay Area's vulnerability to liquefaction, which was observed in many locations.
- The most significant source of property damage during the Loma Prieta earthquake was to wood frame construction, the dominant construction type for residential exposure in California.
The Unusual Suspects: Surprising Rupture Characteristics
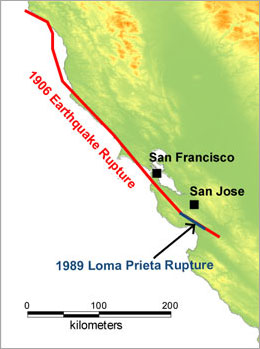
The fault rupture, which extended along a 25-mile segment of the northern San Andreas Fault, originated near the Loma Prieta peak in the Santa Cruz Mountains, some 60 miles south of San Francisco. The quake registered a moment magnitude of 6.9 and was felt from as far away as Los Angeles, southern Oregon, and western Nevada.
In 1988 the Working Group on California Earthquake Probabilities assigned that very fault segment a 30% probability of producing a magnitude 6 to 7 earthquake in the following 30 years—the highest probability among those faults studied in the Bay Area. So while the vast majority of Bay Area residents had never experienced a strong earthquake (and indeed may have become somewhat complacent), the location and magnitude of the earthquake did not surprise seismologists. A few unusual characteristics of the event, however, have given researchers a lot to think about in the years since.
First was the relatively short duration of strong shaking during the quake, which at 10 to 15 seconds was approximately half as long as would be expected from an earthquake of this magnitude. This was likely because the start of the rupture was located in the middle of the fault segment, instead of at the end. Consequently, the rupture progressed simultaneously in both directions, cutting short the travel time. This brought up concerns of whether the damage caused by Loma Prieta should be considered representative for Bay Area earthquakes, as a more typical earthquake with a longer duration of strong shaking would likely have been more destructive.
A second surprising feature was the depth of the earthquake and the faulting mechanism. The depth at the point of rupture (focal point) has been estimated at more than 10 miles—unusually deep compared to typical shallow crustal events on the San Andreas Fault. Also contrary to conventional wisdom was the large reverse-slip thrust component of the fault motion, which caused over 4 feet of vertical displacement, in addition to the expected horizontal, right-lateral, strike-slip motion that generated a maximum horizontal displacement of about 6 feet. The fault rupture propagated upward for several miles, but—probably as a result of its unusual depth—did not break the ground surface. Instead of a continuous visible fault trace on the ground, surface cracks appeared in a diffuse and indistinct area along the fault zone, which caused damage to houses, roads, and underground pipelines.
While the fault segment that ruptured in 1989 overlaps the segment that ruptured during the 1906 San Francisco earthquake, the unusual depth and rupture geometry suggest that the two earthquakes may have occurred on different fault planes. Seismologists have consequently proposed that the Loma Prieta quake did not release strain accumulated on the northern San Andreas Fault since the 1906 event, leaving the probability of a stronger shallow quake essentially unchanged. As a point of comparison (and keeping in mind that rupture length correlates well with magnitude), the 1906 earthquake ruptured nearly 300 miles of the San Andreas Fault, while the Loma Prieta earthquake ruptured only 25. A larger quake closer to urban centers, and one that will more rigorously test the Bay Area's building stock, seems all but inevitable.
Ground Motion, Soil Failure, and a Few More Surprises
Soil Amplification
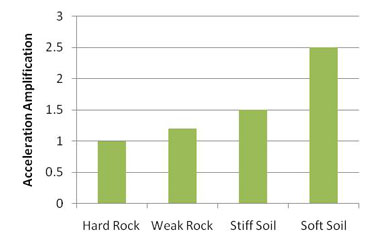
In 1989, the Bay Area was well instrumented by the California Strong Motion Instrumentation Program and the United States Geological Survey (USGS), which provided more than 100 strong motion records at locations with different underlying geology, including sites on rock, soft soil and landfill. Maximum recorded peak accelerations exceeded 0.6g at rock sites near the epicenter and soil sites displayed significant ground motion amplification—by as much as 200% to 300%—compared to adjacent rock sites. Figure 3 shows comparisons of recorded acceleration at locations with various site conditions versus adjacent bedrock sites in the Bay Area. While scientists had observed these site effects in previous quakes—most notably during the 1985 Mexico City quake just a few years prior—no general attenuation function had yet been developed to account for soft soils.
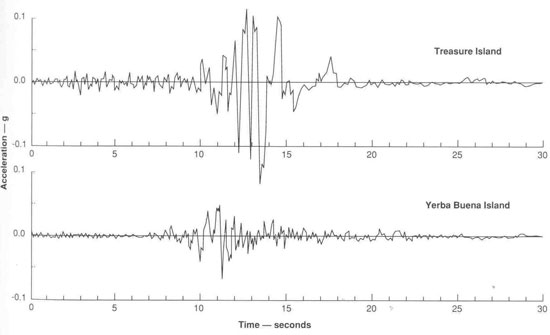
One particularly interesting case study involved two adjoining islands in the San Francisco Bay, Treasure Island and Yerba Buena Island, both located at a distance of about 50 miles from the epicenter. Treasure Island was created in the 1920s by hydraulically filling sand over underwater bay mud deposits, while Yerba Buena Island is a natural rock outcrop. Recordings obtained during the main shock of the Loma Prieta earthquake as well as during subsequent aftershocks showed significant amplification at the soft soil Treasure Island site, where recorded peak accelerations were more than two times higher than those at Yerba Buena Island.
The Moho
While shaking was undoubtedly stronger on soft sediment sites, this alone could not sufficiently explain the anomalously strong observations recorded at considerable distance from the epicenter—even at rock sites. Several studies have suggested that seismic waves from the Loma Prieta earthquake hit a boundary called the Mohorovičić discontinuity (or Moho), located between the earth's crust and mantle. Because of the difference in density between these two layers, waves that strike at a sufficiently shallow angle bounce back to the surface with increased strength, instead of decreasing monotonically with distance from the epicenter—a phenomenon called critical reflection. These reflections, collectively referred to as the Moho bounce, are believed to have increased ground motions by a factor of two or three in the San Francisco and Oakland areas. Recognizing that past attenuations relationships may underpredict ground motion at certain distances from the epicenter, seismologists have incorporated flat portions into modern equations to account for this phenomenon. (For a discussion of the latest research on ground motion attenuation, see the AIR In Focus blog post "From Catalog to Ground Motion: The 2014 USGS National Seismic Hazard Maps.")
Liquefaction
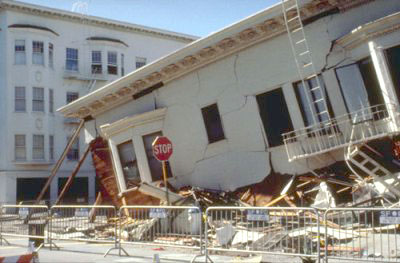
In addition to stressing the importance of geological conditions in determining seismic hazard, the Loma Prieta earthquake also confirmed concerns regarding the Bay Area's vulnerability to liquefaction—the phenomenon that causes loose water-saturated soil to behave as a liquid when subjected to strong shaking. Under the right conditions, artificial landfill and loosely compacted natural deposits can lose their ability to resist compacting, spreading, or sliding, as well as their ability to support structures, roads, and underground utilities. Liquefaction was observed at many locations during the earthquake, including Santa Cruz, Watsonville, Moss Landing, and Oakland, but particularly hard hit were parts of San Francisco, where the pattern of liquefaction damage eerily echoed that during the 1906 quake. In the Marina District, which was created after the 1906 earthquake using manmade landfill, liquefaction contributed to the collapse of several buildings (see Figure 5).
In general, existing liquefaction susceptibility maps at the time accurately identified areas prone to damage, although some inconsistencies stressed the need for more detailed mapping of subsurface conditions. In addition, the earthquake provided one of the first opportunities to test ground compaction and other soil stabilization methods meant to mitigate damage in liquefaction-prone areas. Encouragingly, no ground failure occurred on any improved sites and thus no building damage occurred to structures built on such sites. Buildings on adjacent unimproved sites, on the other hand, displayed settlement and resultant cracking.
Building Performance and Seismic Design
The Usual Suspects
Given the remote location of the epicenter and fairly limited ground motions, buildings generally performed reasonably well during the Loma Prieta earthquake and engineers reported no significant surprises. Buildings that were well designed and constructed withstood the earthquake well; the types of structures that failed—some catastrophically—were previously known to be vulnerable. For example, when the Cypress Viaduct and the Bay Bridge were constructed (in the 1950s and 1930s, respectively), seismic design standards for bridges did not include any provisions for ductility. But after the 1971 San Fernando earthquake, during which several brittle concrete structures collapsed, the need for these structures to be reinforced with steel to enhance ductility was widely recognized and put into practice for new structures in the 1976 Uniform Building Code.
Likewise, a consistent pattern of failure of unreinforced masonry (URM) buildings—first identified during the 1868 San Francisco earthquake—repeated itself (quite disastrously) in 1906 and in subsequent California earthquakes in 1925, 1933, 1952, 1971, 1983, and 1987. Not surprisingly, then, the pattern was repeated during the 1989 Loma Prieta earthquake. According to the Association of Bay Area Governments, 12% of the units rendered uninhabitable by the Loma Prieta earthquake were located in URM buildings, even though they accounted for only 1% of Bay Area housing stock. While the Field Act passed after the 1933 Long Beach prohibited new URM construction, many older masonry buildings remain standing today and, unless adequately retrofitted, will inevitably fail in disproportionate numbers in the next big quake.
The most significant source of property damage during the Loma Prieta earthquake was to wood frame construction, which is to be expected given that this construction type dominates residential exposure in California. The light weight of these buildings minimizes inertial forces and, therefore, the strain imparted on the building's structural elements. While most such wood frame buildings performed well, older single family homes in the epicentral region that were not properly secured to their foundations or that had weak cripple walls below the first floor did not. Severe damage was also observed to multifamily wood-frame structures with open spaces on the ground floor used for parking or retail purposes. These so-called "soft stories" lack the ability to resist significant lateral forces and are prone to collapse, especially when built on soft soils, as in the Marina District.
While engineers had foreseen the severity of damage that an earthquake like Loma Prieta would incur, this is not to say that the event had no far reaching impact on our understanding of building vulnerability or on seismic analysis. In particular, the interesting geotechnical aspects of the event provided a clear basis for strengthening seismic codes for structures built on soft soils. Additionally, the wealth of observational data resulting from the earthquake provided engineers with guidance in selecting ground motion records appropriate for seismic design.
Uncertain Future?
There remains considerable uncertainty regarding future building performance in the face of larger magnitude Bay Area earthquakes. For example, the Loma Prieta quake demonstrated once again that soft soils not only increased ground shaking, but also altered the frequency content of the ground motion, in particular by amplifying the long-period components by as much as eight to ten times. In addition, larger magnitude earthquakes are expected to be significantly richer in long-period components of the ground motions. This has significant implications for tall buildings built in the 1970s and 80s on reclaimed land in downtown San Francisco, whose response in the next great quake will certainly exceed design specifications. Also untested are the retrofit efforts from the last two decades that aim to mitigate some of the types of damage observed during Loma Prieta, especially for URM and wood-frame buildings.
For now, the 1906 M7.8 earthquake remains the defining event for illustrating Northern California earthquake potential. Were it to recur today, AIR estimates ground-up losses (monetary damage to all properties, before the application of insurance terms) of USD 268 billion, compared to USD 24 billion for a recurrence of the Loma Prieta earthquake. Nevertheless, the 1989 event, as the first truly significant Bay Area quake since 1906, left a far-reaching legacy in seismological, geotechnical, and engineering inquiry and served as a crucial wake-up call to the public to prepare for the next "Big One." Fortunately for residents and business owners, the Bay Area has some of the strictest seismic codes in the world, which have improved significantly as a result of lessons learned from past earthquakes. However, these codes do not apply retroactively and the explosive growth of exposures in the Bay Area after 1906 remains largely untested by strong ground motions.
The Loma Prieta earthquake stressed some important geotechnical lessons—especially regarding soft soil amplification and liquefaction—that resulted in significant improvements in subsequent design codes. The earthquake also provided a wealth of data that has led researchers to develop superior analytical methods for quantifying these geotechnical effects.
Who Will Pay for the Next "Big One"?
In January 2014, AIR ran an article in AIR Currents exploring the financial and insurance ramifications of the next Great California Earthquake. We chose a simulation of an M7.9 earthquake on the San Andreas Fault that is similar to the 2008 ShakeOut scenario.
We found that the shortfall in earthquake insurance coverage in California means that the next large event will have far-reaching consequences across private and public sectors. (Please read the article and see the infographic below to learn more.)

While the engineering community reported no real surprises, there was a large gap between the state of scientific knowledge and societal expectations regarding acceptable building performance. Structures were largely designed to avoid collapse and ensure life safety, and the general public was shocked by the larger economic impact resulting from post-earthquake business interruption and loss-of-use. Current practice is gradually leaning toward bridging this divide by implementing performance-based, rather than prescriptive, design and analysis. Earthquakes of course are characterized by considerable uncertainty, and the unknowns with respect to the next big Bay Area event may seem daunting. While many challenges remain, the last twenty years since the Loma Prieta earthquake have seen tremendous progress in our understanding of the natural phenomenon and our ability to prepare for the inevitable.
Association of Bay Area Governments (2003), "Loma Prieta and Northridge Were a Wake-Up Call," http://www.abag.ca.gov/bayarea/eqmaps/nightmare/problem2003.pdf
Hess, R.L. (2008), "Impacts of a M7.8 Southern San Andreas Earthquake on Unreinforced Masonry (URM) Buildings," U.S. Geological Survey Open File Report 2008-1150
Catchings, R.D., Kohler, W.M. (1996), "Reflected seismic waves and their effect on strong shaking during the 1989 Loma Prieta, California, earthquake," Bulletin of the Seismological Society of America; October 1996; v. 86; no. 5; p. 1401-1416
Holzer, T.L. (1998), "The Loma Prieta, California, Earthquake of October 17, 1989—Liquefaction," U.S. Geological Survey Professional Paper 1551-B
Housner, G.W. et. al. (1990), "Competing Against Time," Report to Governor George Deukmejian from the Governor's Board of Inquiry on the 1989 Loma Prieta Earthquake
Kircher, C.A., Seligson, H.A., et. al. (2006), "When the Big One Strikes Again — Estimated Losses due to a Repeat of the 1906 San Francisco Earthquake," Earthquake Spectra Volume 22, Issue S2
National Research Council, Geotechnical Board (1994), "Practical Lessons from the Loma Prieta Earthquake," National Academy of Sciences
Segall, P., Lisowski, M. (1990), "Surface Displacements in the 1906 San Francisco and 1989 Loma Prieta Earthquakes," Science, 30 November 1990: Vol. 250. no. 4985, pp. 1241 - 1244
Somerville, P., Yoshimura, J. (1990), "The influence of critical Moho Reflections on strong ground motions recorded in San Francisco and Oakland during the 1989 Loma Prieta Earthquake," Geophysical Research Letters, 17(8), 1203-1206.
