


Reformulating a Seismicity Model for Japan
Apr 29, 2013
Editor's Note: A previous AIR Currents article provided an overview of the update to the AIR Earthquake Model for Japan that will be released in the summer of 2013, which is the first industry model to include tsunami, liquefaction, and fire following. In this article, AIR Director of Earthquake Hazard Research Dr. Mehrdad Mahdyiar and Senior Science Writer Robert Zalisk outline the changes in Japan's seismicity and how the update accounts for them.
Japan is especially susceptible to earthquakes. But the 2011 Tohoku earthquake that ruptured off the northeast coast of Honshu, the most powerful earthquake in Japan ever recorded, was different. Its magnitude, its location, and the formidable tsunami it generated stunned scientists and caught public safety officials by surprise.
Since then, seismologists have had a double-edged question to unravel: First, what can the Tohoku earthquake reveal about seismicity in Japan that was not known or clearly understood prior to the March 11, 2011, catastrophe? And second, how did the very occurrence of that event affect the seismic dynamics of the region: where has stress increased, where has it lessened or remained the same, and which faults may now be more likely to rupture—and to rupture on what timescale? This article discusses the latest research concerning seismicity in post-Tohoku Japan and how AIR's 2013 model is the first in the industry to include the new conditions the Tohoku catastrophe brought about.
Reconfiguring Seismic Source Zones along the Japan Trench
The Japanese agency responsible for periodically publishing estimates of seismicity for Japan is the Headquarters for Earthquake Research Promotion (HERP). Based on the National Seismic Hazard Maps HERP issued in 2007, the area along the Japan Trench (which parallels northern Honshu) was configured into eight seismic source zones (Figure 2a) more or less following the pattern of historical earthquake ruptures as they were understood at the time. Six of the eight zones experienced full or partial ruptures during the Tohoku quake. The amount of seismic energy released varied considerably from zone to zone, and these differences have helped to determine not only new states of seismicity at the different locations, but also help clarify the conditions that actually existed prior to Tohoku.
 By: Dr. Mehrdad Mahdyiar
Senior Director, Earthquake Research
 By: Robert Zalisk
Senior Science Writer
Edited by Nan Ma
The article: Gives an overview of how the 2011 Tohoku earthquake changed the state of seismicity in Japan, especially in northern Honshu, and describes how those changes have been incorporated into the updated AIR model.
Highlights: Going far beyond simply revising the rupture occurrence probabilities of the previous model, AIR's updated model reflects a new understanding of many aspects of seismicity in Japan. It represents the industry's most comprehensive solution to modeling earthquake risk, post-Tohoku.
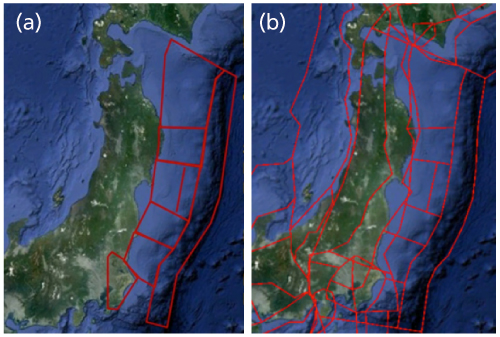
AIR researchers used HERP's latest findings, other published research, and their own studies to reconfigure the seismic source zones to reflect an emerging new understanding of seismicity along the Japan Trench (as also for along the Nankai Trough, as outlined below). Figure 2b illustrates AIR's new configuration of seismic sources for Japan that have been incorporated into the model update.
The changes are immediately apparent, not simply with respect to the boundaries, dimensions, and the number of the zones, but also for the greater complexity they display, representing zones where large interplate earthquakes, tsunamigenic earthquakes, and intraplate normal faulting are characteristic.
The Nankai Trough and Tsunamigenesis
The greatest changes in seismicity caused by the Tohoku earthquake were in the northern part of Honshu and between Honshu off the Tohoku region and the Japan Trench. The prevailing understanding is that because Tohoku released so much accumulated energy, another "megathrust" earthquake is not likely to happen along that part of the Japan Trench any time soon. Given the current state of stress in the Japan region, such an event, which also would have the potential for causing a very destructive tsunami, is more likely to happen along the Nankai Trough to the south.
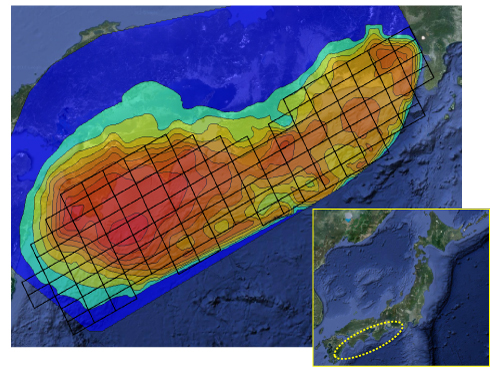
As they did for the Japan Trench, AIR researchers determined new configurations for the sources of seismic activity along the Nankai Trough, which, as seen in Figure 3, runs roughly parallel to the coast of southern Honshu. New data indicate that the angle of dip (the angle between the fault plane and the horizontal) at Nankai is more acute, or shallower, than previously thought. The significance of this possibility is that a rupture along the Nankai subduction zone—thought to be at a depth of about 35 km—would occur much closer to land, if not actually beneath southern Honshu in some locations. In addition, AIR's newly configured seismic source zones allow for the possibility that Nankai is capable of producing earthquakes that could rupture as many as four fault segments—one more than previously considered. It is a possibility also considered by new scenarios published by the government of Japan.
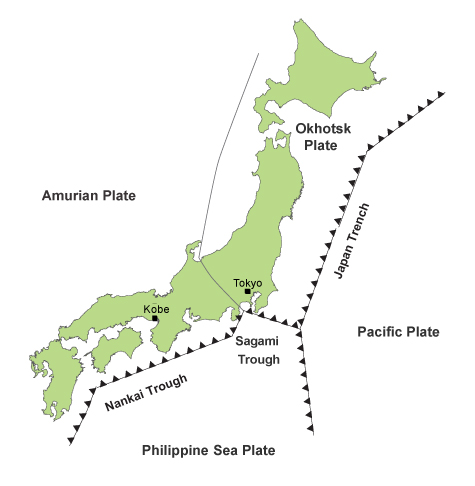
Japan's Tectonic Geometry
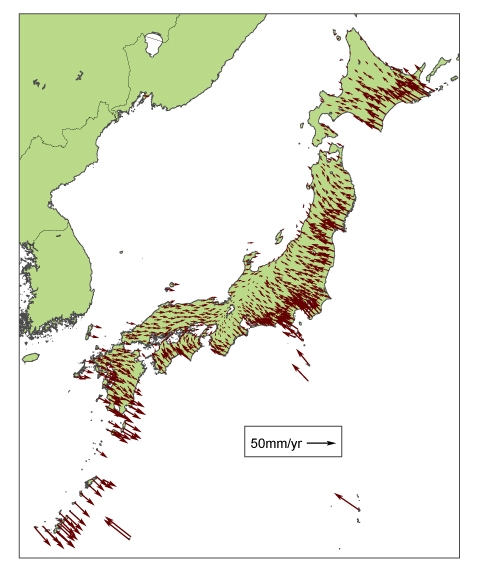
Japan is dominated by subduction activity, the movement of one plate under another. Figure 1 presents a simplified outline of where the four major tectonic plates—the Pacific Plate and the Philippine Plate, and the Amurian Plate and the Okhotsk Plate—come together at Japan. The small triangles along the Pacific and Philippine Plate boundaries on the map indicate the direction the plates are moving.
All four plates come together at one place, the Sagami Trough. This is where the most complex interactions among the plates are happening, where some plates are themselves being subducted even while subducting others. The effects of these actions extend under mainland Honshu (Japan's largest island) at the Kanto Plain. The Kanto Plain is the most densely populated and heavily industrialized region of Japan. Tokyo is located here; thus, understanding the intricate tectonic dynamics of this area is central to being able to estimate earthquake risk for the greater Tokyo area.
To locate likely sources of tsunamigenesis (tsunami-formation), AIR researchers identified highly coupled areas within the Nankai subduction zone. ("Coupling" refers to the degree of fault-locking between adjacent rock surfaces along a fault; the greater the coupling, the greater the resistance and locking—and thus the associated buildup of stress.) To do this, the researchers constructed a kinematic block model—a physically-based model that treats a seismically active region as if it were a system of rigid blocks—for the length of the Nankai Trough. Researchers used this block model to invert the GPS-derived ground movement data into a coupling coefficient footprint over the subduction zone (Figure 3). Areas with high coupling coefficients are the most likely to have the largest displacement in future large earthquakes.
Seismogenic Influences on the Kanto Plain
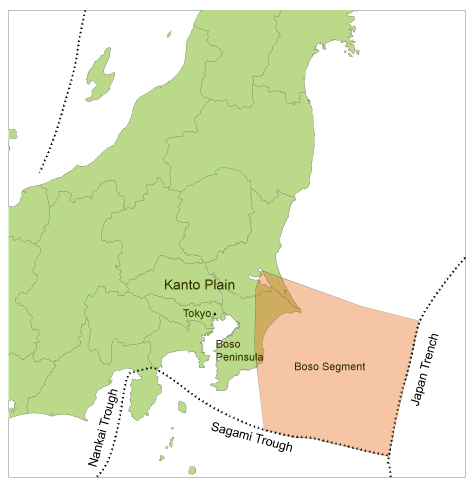
The Kanto Plain region, shown in Figure 4, stretches across the middle of Honshu, midway between the northern half of the island (where seismicity is dominated by the Japan Trench) and the southern half (where seismicity is dominated by the Nankai Trough). As noted earlier, this is where Tokyo is situated, and it holds the major concentration of exposures for all of Japan. Significantly, the plain is exposed to earthquake hazard from diverse sources, most traceable to the relentless subducting action of the Pacific and Philippine Plates, the complex interaction of the plates with each other, and the still uncertainly understood interaction of the plates with the region off the Boso Peninsula referred to as the Boso Segment.
The Subducting Plates
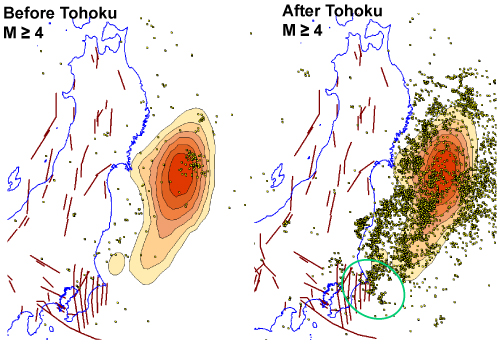
The chief source of seismicity on the Plain has been the movement of the underlying subducting Philippine and Pacific Plates. The rupture of large-magnitude earthquakes like Tohoku alters the stress borne by other faults nearby, out to a distance of at least several hundred kilometers. Indicating such changes in stress, the rate of earthquake occurrence increased significantly after the Tohoku earthquake struck—mostly close to the epicenter, but also in the Kanto Plain region (see area circled in green in Figure 5b).
This change was used by AIR researchers to provide values for some of the parameters of a "rate-state" model, a physical model that simulates earthquake genesis. The researchers could thus generate scenarios that show the likelihood that different faults within the Kanto Plain might rupture. They employed several procedures in this effort. For example, a "Coulomb failure stress change" analysis of the Plain was also conducted, using values obtained for the Tohoku region. (Coulomb failure stress change is a physics-based mathematical operation that produces estimates of changes in the state of stress in a seismic system).
The results of the studies indicate that the Tohoku earthquake increased the state of seismic stress on both the Pacific-Philippine plate interface and Pacific intraslab faults in the region. Indeed, they suggest that the 30-year probability of an M = 6.7 earthquake happening has potentially increased from 72% to approximately 81-93%, depending on the assumptions.
The Boso Segment
The "Boso Segment" was an unnumbered zone or area on the 2007 HERP maps, located where the Philippine, Pacific, and Okhotsk Plates meet (see Figure 4).
Historically, the Boso Segment has been quiescent. Indeed, the only large historical event that might have occurred there is an earthquake in 1677, about which little is known. Based on this history, HERP, in 2007, considered the segment to be weakly coupled or not coupled at all and did not formally identify the segment as a source of seismic activity. However, seismologists can no longer automatically assume that the Boso Segment's long history of quiescence is attributable only to seismic inactivity; on the contrary, the segment may actually be strongly coupled and accumulating increasingly more energy—as was the case in Tohoku.
Figure 6 depicts ground movement for all of Japan as indicated by GPS-derived data (that is, ground movement measured by satellite with laser precision). However, this surface movement does not directly reflect the underlying deep seismicity of the subducting plates—especially given the distorting influence of a 10 kilometer-thick section of plate of uncertain origin that recent studies indicate is wedged between the Philippine and Pacific Plates, strongly coupled to one or perhaps both.
To resolve this conundrum, AIR seismologists used the GPS results shown in Figure 6 to determine the state of coupling in the region. As with their analysis of the Nankai Trough, they first constructed a kinematic block model (this time for the Kanto Plain, including the Boso Segment). Again, a block model normally uses GPS data to generate estimates of how coupled a seismic system is. By inputting test coupling values—that the system was 0% or 50% or 100% coupled—the model can estimate (using kinematic inversion algorithms) what degree of coupling is most consistent with the empirical GPS data.
Based on such estimates and similar results from other efforts, it was concluded that the Boso Segment is, in fact, at least partially coupled and is capable of generating an earthquake as large as M8.6. An earthquake of this magnitude would be the largest ever to occur in this region and would cause significant shake damage in the greater Tokyo area. Moreover, it also could generate large tsunami waves around the Boso and Izu Peninsulas, which would result in additional damage.
Closing Thoughts
The Tohoku earthquake in March of 2011 wrought extensive changes to the seismicity of Japan. The full extent of those changes, how some of the changes have been identified, and what remains to be determined, have been only touched on here. In summary to the explanations offered here, Figure 7 provides a comparison of seismic hazard in northern Honshu as generated by AIR's 2008 Japan Earthquake Model and AIR's 2013 model update.
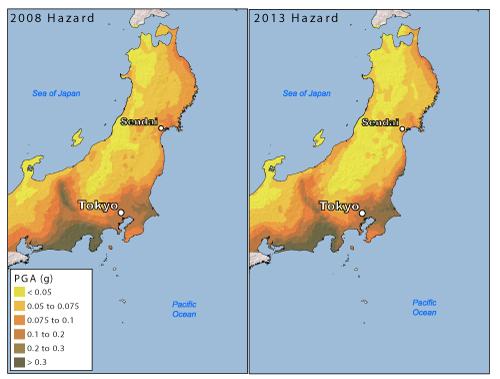
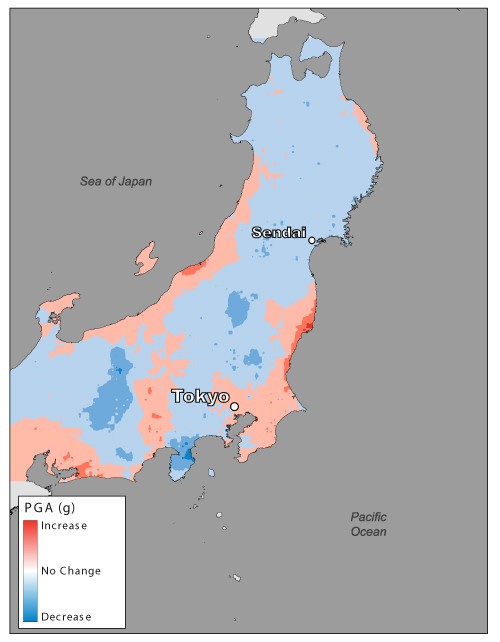
Looking at the two maps, it is possible to discern the generally diminished seismicity to the north, where the Tohoku region lies around Sendai, and also some increased seismicity near Tokyo and on the Boso Peninsula on the Kanto Plain. The changes are more apparent in Figure 8, however, which shows only the relative increases (in gradations of red) and decreases (in gradations of blue) in seismic hazard between the two maps above.
A central lesson Tohoku has taught the research community is that it cannot rely on historical data alone to determine the risk from large damaging earthquakes: a region believed to be weakly coupled based solely on the historical record may actually be strongly coupled. This lesson, along with other insights on seismicity in Japan and the fact that so much destruction was caused by earthquake risk factors that previously had not been modeled—a massive tsunami, liquefaction, fire following—shaped the objectives of AIR researchers and modelers in developing the update to the AIR Earthquake Model for Japan.
