


Real-Time Catastrophe Loss Estimates—What Do They Really Mean?
May 23, 2013
Editor's Note: The estimates of hurricane losses posted by AIR on its ALERT website two days ahead of landfall usually include a wide range of possibilities. This article explains what the range means and why it narrows as the storm approaches land.
On August 27, 2012, Tropical Storm Isaac had already passed through the Florida Keys, where it had delivered plenty of rain and wind but caused little damage. The Gulf Coast would not fare as well. Approaching from the southeast at a speed of 14 mph, the storm was expected to strengthen amid low wind shear conditions and warm sea surface temperatures. Anticipating landfall at hurricane strength in the next 48 hours (somewhere between Cameron, Louisiana, and Mobile, Alabama), AIR released the first in what ultimately would be a series of four real-time loss postings for this event.
AIR has been issuing loss estimates for U.S.-landfalling hurricanes since Hurricane Hugo, which struck the United States in August of 1989. The service was formalized ten years later, in 1998, with the launch of the ALERT™ (AIR Loss Estimates in Real Time) website. Today, companies have come to depend on the reliability and timeliness of AIR loss estimates to help them plan loss mitigation and resource allocation strategies, communicate effectively within their organizations, and set expectations for investors.
Given the complexity and uniqueness of each hurricane, companies may wonder how AIR produces ALERT estimates and how they should interpret the range in estimates. Using Hurricane Isaac as an example, this article describes how AIR uses a full probability distribution of losses to represent the uncertainty in the event parameters and in factors pertaining to the local intensity calculation, damage estimation, and insured loss calculation.
 By: Dr. Tim Doggett
Senior Principal Scientist
 By: Kathryn Fobert
Science/Technical Writer
Edited by Nan Ma, CCM
The article: Explains how AIR's ALERT loss estimates are calculated and how losses are associated with an exceedance probability (EP) curve that captures an event's uncertainty in real time.
Highlights: A key differentiator in the ALERT process is that AIR does not choose like events from the stochastic catalog, but rather treats each hurricane as a unique event.
The Initial Posting—A Relatively Wide Range of Losses
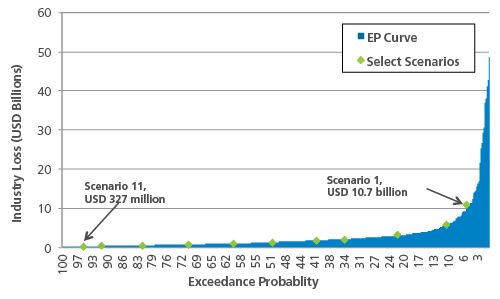
With Isaac still two days from landfall, the AIR hurricane modeling team gathered actual storm parameters from the National Hurricane Center and generated a unique event set of 490 possible realizations of the storm's future progress. AIR then ran the U.S. hurricane model with this event set to produce a full probability distribution of losses. From this distribution, AIR selected 11 scenarios that best represented the full range of losses and made their associated tracks, wind speed footprints, and losses available for clients to view on the ALERT website. These scenarios were not assigned an equal probability of occurrence; rather, each loss was associated with an exceedance probability, as will be discussed in greater detail later. AIR also made the select scenarios and the full event set available for clients to download for use in AIR's software systems. With the goal of enhancing both the interpretation and communication of the ALERT estimates, AIR recommended that clients utilize the full event set so as to generate an EP (exceedance probability) curve based on their own portfolios, thereby allowing them to produce both the probabilities of loss and the uncertainty associated with those probabilities.
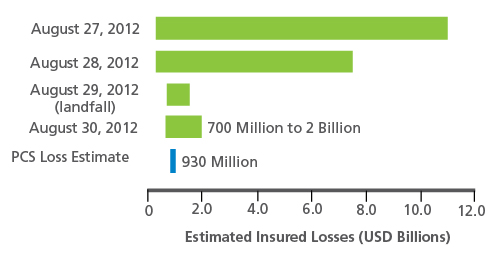
In the initial posting on August 27, AIR estimated that insured losses in the U.S. would be in the range of USD 300 million to USD 11 billion. AIR provided this range with a 90% confidence level, meaning that given the then-current forecast and its uncertainty, insured losses in excess of 11 billion or less than 300 million were possible, but were associated with a low probability of occurrence (5% in each case).
This relatively wide distribution of losses reflected the large amount of uncertainty associated with the storm parameters, even as the hurricane approached landfall. For example, according to the NHC forecast of August 27, Isaac's intensity at landfall could be as low as Category 1 or as high as Category 3 strength.
At the time of the pre-landfall posting, there also was uncertainty with regard to the storm's radius of maximum winds (Rmax), a parameter critical to the loss estimation calculation as it determines where the storm's strongest wind speeds are located and the overall size of the wind footprint. Since the NHC forecast advisories did not provide information on Rmax, AIR estimated this variable from other meteorological sources. Uncertainty in Rmax translated to uncertainty in both the local intensity calculation and the extent of damage.
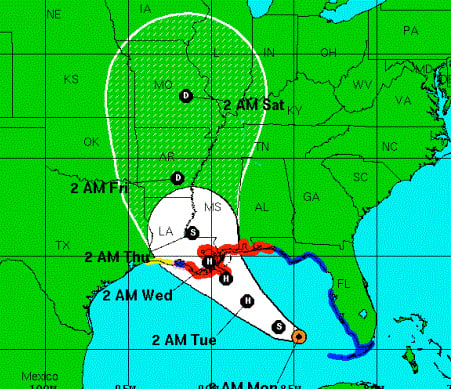
Lastly, there was still uncertainty with respect to the storm's future track. On August 27, the NHC cone of uncertainty (Figure 2) included possible landfall locations that extended from Mobile, Alabama, westward to Lake Charles, Louisiana, with the most probable landfall occurring on the Mississippi Delta area of Louisiana and extending inland over New Orleans. (NHC's cone of uncertainty represents a 67% confidence interval based on past events.) AIR assumed that the possible storm tracks were normally distributed around the central forecast track within the cone; the mean loss estimate, then, corresponded to the mean of the distribution and was very close to the losses that would result if the NHC's current central forecast track was realized.
In the initial posting, two days prior to landfall, the high end of the loss range represented the possibility of Isaac intensifying to a strong Category 3 storm, developing a large Rmax, and tracking over the highly concentrated exposure around New Orleans. The low end of the range reflected Isaac making landfall as a weak Category 1 storm in western or central Louisiana, where exposure is less concentrated than in New Orleans. In the end, neither of these scenarios materialized.
The Range Narrows
AIR posted two more sets of loss estimates, each with a progressively narrower range, before issuing a final estimate one day after landfall. Again, each loss estimate range represented a 90% confidence level, as higher or lower losses were possible but highly unlikely. The final posting estimated losses at between USD 700 million and USD 2 billion.
At the time of the final posting, Isaac's status as a Category 1 hurricane was known, but there was still uncertainty with respect to its actual surface-level wind speeds when it made landfall, first in Plaquemines Parish, Louisiana, and then in Port Fourchon. In addition, there was still some uncertainty with regard to Isaac's actual Rmax at landfall, although the largest possible Rmax never did actualize.
Uncertainty in the Final Posting
While uncertainty in the storm parameters decreased as landfall neared (and even more after landfall), there was still uncertainty in both the local intensity and the damage calculation to consider. Isaac was a very large, slow-moving storm that impacted the region for a considerable time—but actual wind speeds and storm surge levels were not clear at the time of the final posting. As noted earlier, there was significant uncertainty with respect to the actual surface-level wind speeds. While the NHC reported 80 mph winds at both landfalls, these were in fact estimates derived from flight-level measurements and do not reflect actual measurements from onshore stations, which often can be significantly lower.
As part of the final posting process, AIR scientists analyzed the available wind and storm surge observation data. In light of that analysis, factors such as the gradient wind reduction factor (GWRF), which determines how flight-level winds translate to surface wind speed, can be adjusted to optimize the hazard validation. AIR also captured a range of possible storm surge depths in the final posting. Therefore, while uncertainty certainly diminished with landfall, it was not eliminated entirely. Thus, the final loss posting still consisted of a range of losses.
Interpreting Losses in Terms of the EP Curve
A key differentiator in AIR's ALERT methodology is that the loss estimates are generated from running the AIR U.S. hurricane model using actual storm parameters issued by the NHC rather than on running "similar events" from the model's stochastic catalog. The result is a full exceedance probability (EP) curve, much like one generated from any typical model run. (For an introduction to how exceedance probabilities are calculated, read this Modeling Fundamentals article.)
AIR researchers spend days collecting, cleaning, and carefully analyzing data to produce an event set that consists of dozens or even hundreds of events that best represent the storm's potential progress. While identifying "like events" from the stochastic catalog would certainly be a simpler approach, these events are certain to be different from the actual event unfolding. Even slight inconsistencies in track, intensity, or Rmax can result in major differences in losses.
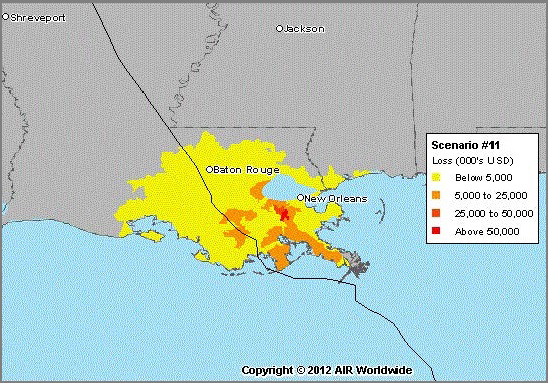
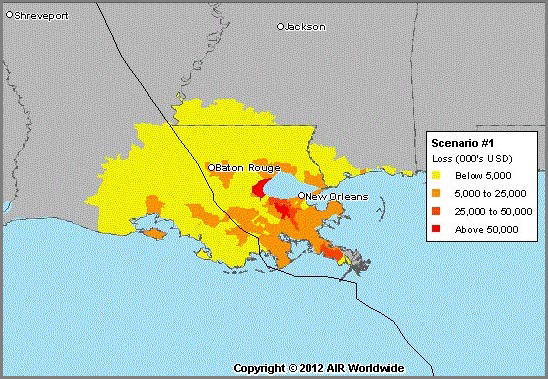
To produce a scenario set, AIR chooses those points on the EP curve that best represent the full range of potential industry losses, with each scenario corresponding to a particular track and set of storm parameters. For example in Isaac's final posting, Scenario 1 represents a point on the EP curve in which there is a 5% probability of insured losses exceeding USD 2 billion. Isaac, in this scenario, makes landfall in Lafourche County, Louisiana, as a Category 1 storm with maximum wind speeds of 87 mph and an Rmax of 36 miles. Scenario 11 represents a 95% probability of insured losses exceeding USD 700 million. This scenario has Isaac making landfall in Lafourche County, Louisiana, as a Category 1 storm with maximum wind speeds of 79 mph and a radius of maximum winds of 30 miles.
In the end, Isaac caused USD 930 million in insured losses according to PCS, which was very close to the mean of AIR's final loss distribution (nearly USD 1.2 billion). The mean corresponded with an exceedance probability of about 50%. Note that AIR estimates cover clearly specified sources of loss, which are also clearly delineated on the ALERT site.
Conclusion
The range of losses in pre-landfall ALERT postings for U.S. hurricanes is indicative of the uncertainty in a storm's future track, intensity, and Rmax at landfall. An EP curve, which AIR generates from the U.S. hurricane model, captures these and many other sources of uncertainty. As the storm gets closer to landfall, the uncertainty decreases and so does the range of insured losses in each posting—but uncertainty is never eliminated.
While the primary purpose of the U.S. hurricane model is to prepare clients for potential losses before they occur, the ALERT methodology of combining real-time data with hurricane modeling and an enormous body of knowledge about the vulnerability of structures to hurricane winds and storm surge has shown that the model can also produce reliable loss estimates as events unfold.
