


New Tools to Account for Non-Modeled Sources of Loss
Jan 24, 2013
Editor's Note: In light of recent catastrophes, companies are re-examining their portfolios with an increased focus on the impact of non-modeled perils. In this article, AIR's Senior Vice President for Research and Modeling, Dr. Jayanta Guin and Vice President, Product Management, Ashish Belambe, discuss AIR's varied approaches for addressing this challenge.
Since AIR released the first probabilistic catastrophe model to the insurance industry in the late 1980s (the U.S. hurricane model), the breadth of modeling has increased dramatically. Today, AIR offers catastrophe models for more than 90 countries covering a wide variety of perils.
The purpose of modeling is to anticipate the likelihood and severity of catastrophes so that companies can prepare for their financial impact—before they occur. The evidence suggests that, for the most part, modeling has achieved its mission. Eleven insurers became insolvent after Hurricane Andrew in 1992, while none faced that consequence after Hurricane Katrina's assault on the Gulf Coast in 2005. Today, catastrophe modeling is an integral part of the risk management process.
Still, a series of large catastrophe losses in recent years has taken some in the insurance industry by surprise. One reason may be that several large losses arose from so-called "non-peak" zones, including the Maule, Chile earthquake in 2010 and the New Zealand earthquakes of 2010 and 2011. Yet AIR's earthquake models for Chile and New Zealand include scenarios that produce much higher levels of loss. AIR has addressed the need for greater awareness of global risk in a recent white paper, Taking a Comprehensive View of Catastrophe Risk Worldwide.
Another reason for the sense of surprise—one that has since become the subject of much discussion in the industry—was the proportion of losses that arose from non-modeled sources. In New Zealand, for example, a significant driver of losses was liquefaction, which occurs when water-saturated soils subjected to ground-shaking lose their strength and ability to support structures. Damage due to liquefaction was also widespread around Tokyo Bay as a result of the 2011 Tohoku earthquake in Japan. While AIR has earthquake models for both Japan and New Zealand, the effects of liquefaction were not explicitly modeled.
More dramatically, there was no tsunami model available in 2011 that could have prepared the industry for the devastation along Japan's Sendai coast after the Tohoku earthquake. Similarly, the 2011 flooding in Thailand—another non-modeled peril—had ramifications that were both broad and deep, affecting worldwide supply chains and even exacerbating the (contingent BI) losses from the Tohoku event.
Thus non-modeled losses may arise from non-modeled perils and regions (such as Thai flood), or from non-modeled secondary perils associated with primary modeled perils (as with liquefaction and tsunami during earthquakes). The events of 2010-2011 highlight the need to make models even more comprehensive and to capture as many drivers of loss as possible. That, however, cannot be accomplished immediately.
This article provides a brief look at AIR's ambitious research roadmap, which is designed in part to address these challenges, and discusses how AIR's next generation catastrophe modeling platform, Touchstone™i , offers alternative approaches that can provide companies with an integrated view of their risk—including that from non-modeled sources—now.

By: Jayanta Guin and Ashish Belambe
Edited by Virginia Foley
The article: Provides a brief overview of AIR's plans for new and enhanced models, and discusses the technological innovations available in Touchstone™, AIR's next generation platform—all of which will help clients manage their non-modeled exposure and drive better business decisions.
Highlights: AIR continues to develop models for new perils and regions worldwide and has slated major releases in 2013. Alongside this, AIR is providing companies with tools to identify and control exposure accumulations so that they can create a more accurate and comprehensive view of their risk.
AIR's Research Roadmap: More and More Comprehensive Models
AIR makes ongoing and significant investments in our models and in ensuring that they continue to be the trusted currency by which companies can confidently assume, manage, and transfer catastrophe risk. Our commitment to our models is reflected in our very ambitious research roadmap. Over the next few years, a number of new models will be introduced that will help companies understand previously non-modeled sources of loss.
The effort is already underway. In 2012, AIR introduced a liquefaction module into the AIR Earthquake Model for Australia that covers urban areas with high liquefaction potential. This summer, AIR is releasing a major update to its Earthquake Model for Japan, which will also include the explicit modeling of liquefaction risk. Going forward, AIR will continue to expand this capability to all modeled regions where the hazard is high and exposure is concentrated.
Of particular significance, as part of the forthcoming update to the Japan earthquake model, AIR is also releasing the industry's first fully probabilistic modeling capability for estimating losses from tsunami. For more detail, please see this month's AIRCurrents article "Earthquake Risk in Japan After Tohoku Updates to the AIR Model."
In addition, AIR has already responded to the industry's call for more detailed approaches to assessing flood risk with the introduction of AIR's inland flood models for Great Britain and Germany. In 2014, AIR will release a comprehensive U.S. flood model and will expand the number of modeled countries in Europe. Looking ahead, countries in the Asia-Pacific region, including Thailand, are featured on the research roadmap. This suite of flood models will make use of the same numerical methodology implemented in AIR's Flood Model for Germany. These are highly sophisticated models that simulate realistic and robust storm patterns over space and time, allowing companies to manage their risk from flooding both on and off the floodplain.
But detailed catastrophe models take considerable time, effort, and expertise to develop. Since the Tohoku earthquake of March 2011, for example, a team of 20 scientists and engineers has been working continually to update the AIR Earthquake Model for Japan to reflect the changes in seismic risk that occurred as a result of that event. Flood models are even more labor intensive. And it is important to note that none of it can be accomplished unless high-quality data at high resolution is available.
Sophisticated Spatial Tools for Managing Non-Modeled Losses
Of equal importance to AIR's commitment to its research agenda are the significant investments that AIR has made on the technology front. These efforts have not gone unnoticed. At their 2012 Special Achievement in GIS (SAG) Awards ceremony, AIR was recognized by Esri, the market leader in geographic information systems (GIS) technology, for our innovative approach to leveraging Esri's geospatial technology to develop interactive tools for visualizing exposure, hazard and loss information within AIR's new catastrophe modeling platform, Touchstone.
These tools provide companies greater insight into their accumulations, allowing them to more easily manage their exposure across the globe and analyze their risk from multiple perspectives within a single platform. Additionally, companies will be able to capture currently non-modeled sources of loss—including losses from secondary perils or in regions not currently modeled—to achieve an integrated view of enterprise-wide exposure to catastrophe risk.
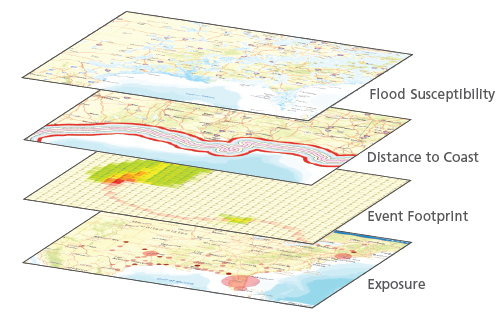
At the portfolio level, a user can overlay several geospatial layers, such as liquefaction maps, distance to coast, or storm surge potential and quickly determine the total exposure for these hazards across their risks.
Figure 1 illustrates the power of combining multiple data layers. In this example, a company began the analysis with their underlying exposures, added information on how the exposures might be impacted by historical events, applied distance to coast metrics, and, finally, added elevation data to assess flood susceptibility. This is a quick way for a user to evaluate a location's catastrophe hazards and determine whether accumulations fall within underwriting guidelines—and, ultimately, control the risk.
Monitor Accumulations
Because Touchstone includes AIR's powerful financial modeling capabilities, it enables users to monitor their concentrations of both modeled and non-modeled exposures by accumulating not just risk counts and replacement values, but also exposed limits after accounting for policy terms (including deductibles, layers, limits and reinsurance treaties). This can help organizations evaluate where accumulations of risk are situated and decide where to grow or retract business.
Companies can also evaluate accumulations in the vicinity of potential terrorist targets, earthquake faults, or other hazard sources included in Touchstone. Users can also import their own or third-party hazard information (e.g., tsunami footprints, return period flood maps, or location data from volcano databases) and analyze their exposure concentrations with respect to these areas of higher risk.
Figure 2 illustrates a user-defined concentric ring analysis of exposure to a potential terrorist target in London—an example that can be replicated anywhere—from Madrid to Jakarta to Mumbai. The user can even assign building damage ratios within each ring; for example, buildings within the first 100-meter ring might experience a loss of 85% of their replacement value, while buildings located further away might be damaged 60% or less.
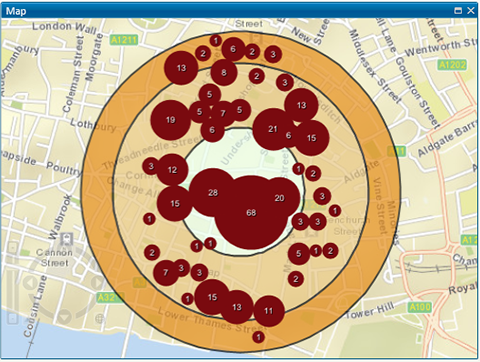
This type of analysis can enable an insurer to uncover non-modeled exposure accumulations; multi-line insurers can use this tool to identify accumulations "hot spots" across several lines of business. Finally, results can be shown on a map or exported to create intuitive reports that can be shared with regulators, rating agencies and other stakeholders.
Develop a Customized View of Risk
Delving deeper, users can take their risk management one step further by developing and importing custom damage footprints to quantify the risk from non-modeled regions or perils.
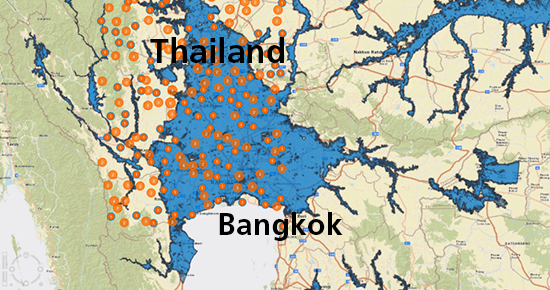
Figure 3 shows a 500-year return period flood hazard map for the Bangkok, Thailand region, which was developed by AIR's flood research team as part of a larger project to develop flood risk hazard maps for key hot spots around the globe (see text box below). Again, companies can bring in their own layer or one from a third party organization.
Suppose a company would like to explore how their portfolio would be affected by such extreme flooding—a more catastrophic one than the 2011 event that disrupted global supply chain networks and caused an estimated USD 12 billion in insured losses. In Touchstone, accumulation zones can be created and centered around major cities such as Bangkok, Chang Mai and Surat Thani— which are well-known flood hazard areas.
The company could also see how much of their exposed limits fall within the flood footprint, and even assign custom damage ratios to assess the potential losses to properties or portfolios of properties from future events. Such an exercise can help the company formulate its own view of the risk by asking questions like: What is our overall exposure in this region? How much of that is within a 100-year or 500-year flood footprint? And how much could we lose in just this region if we apply a damage ratio of 30%, 50%, or even 80%?
Of course, without better knowledge of supply chain risk—another area where AIR is helping companies assess the impact of catastrophes—events similar to the 2011 Thai floods will continue to catch companies off guard. However, using flood hazard maps in Touchstone provides users with a starting point for making better underwriting decisions, accumulation management, and even estimating potential direct losses.
Closing Thoughts
With intensifying scrutiny by regulators and continuing capital pressures, it is critical for organizations to understand their global exposure. To that end, AIR has greatly expanded its suite of catastrophe models. Today, we offer fully probabilistic models for a wide variety of perils, including earthquakes, tropical cyclones, winter storms, severe thunderstorms, flood, wildfire, crop losses, and terrorism. Indeed, what were once considered secondary perils, such as fire-following, liquefaction, storm surge, and precipitation-induced flooding, AIR now explicitly models in many regions.
The scope of AIR modeling will continue to expand with an aggressive research roadmap for the years to come, beginning with major releases in 2013. But equally important to our commitment to detailed modeling is our commitment to providing the tools companies need to manage accumulations for currently non-modeled perils and regions.
Touchstone, the next generation catastrophe modeling platform, will go a long way towards addressing these needs by providing tools to identify and control their accumulations, providing companies with a more accurate and complete view of their overall catastrophe risk.
Editor's Note: The information regarding AIR's research roadmap is provided for information purposes only and may not be incorporated into any contract.
i For more information on Touchstone, please contact an AIR representative for details.
