


Modeling Hurricane Risk in a Warm Ocean Climate— A Measured Approach
Jun 05, 2012
Editor's Note: The 2012 hurricane season officially began on June 1st , marking an opportune time to discuss hurricane risk in a warm ocean climate. In this article, which was originally published in November 2011, Dr. Tim Doggett and Dr. Peter S. Dailey take a look at AIR's warm sea surface temperature catalog and discuss why AIR's approach is the most stable, robust, and scientifically defensible one available.
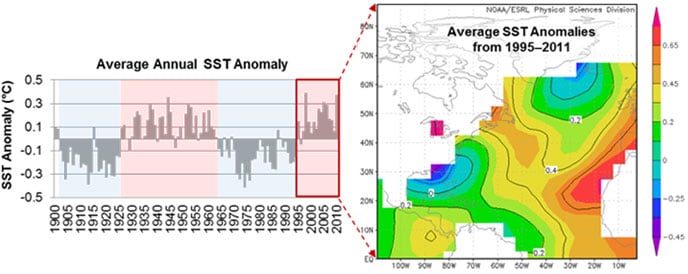
For several decades, researchers have understood that there is a correlation between sea surface temperatures (SSTs) in the Atlantic Ocean and basinwide hurricane activity. As tropical cyclones derive their energy from warm ocean waters, increased heat content provides more fuel for both the formation of storms and their intensification. Some believe that SSTs oscillate between extended warm and cool periods according to an ocean circulation pattern called the Atlantic Multidecadal Oscillation (AMO). Others researchers have found evidence that human-induced global warming has played a dominant role in the increased activity in recent years. Regardless of the underlying mechanism, during the current warm period that began in 1995, an average of 15 named storms have formed per season, compared to a long-term (1950—2010) average of about 11.
It might then stand to reason that if sea surface temperatures can be forecast in advance, it would be possible to quantify their impact on hurricane risk in the United States. In part spurred by seasons like 2004 and 2005, which together caused insured losses in excess of 80 billion USD in today's dollars, the catastrophe modeling industry began to provide alternative views of Atlantic hurricane risk under warm ocean conditions, in addition to the standard view based on long-term hurricane climatology. In 2006, AIR released a near-term hurricane catalog based on expected sea surface temperatures in the following five years. But AIR quickly realized that such an approach carried with it too much uncertainty to be of real value.
Therefore, since 2007, AIR's warm sea surface temperature (WSST) catalog has been one that is conditioned on a warm Atlantic ocean climate. That is, it is constructed in much the same way as the standard catalog, but it is based on data from those years since 1900 during which sea surface temperatures have been higher than the long-term average. Like the standard catalog, it provides a long-term and stable view of risk from landfalling hurricanes, while avoiding the inevitable pitfalls of near- and medium-term SST forecasting.

By: Dr. Peter S. Dailey and Dr. Tim Doggett
Edited by Nan Ma
Limited Skill in SST Point Forecasts
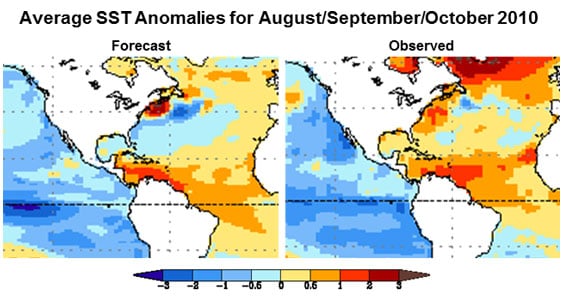
For very near-term forecasts, numerical climate models—such as general circulation models (GCM)—perform quite well. These models solve systems of equations that govern fluid flow and thermodynamics to forecast how atmospheric and ocean conditions evolve with time. However, the forecast skill of these dynamic models, such as the operational coupled forecast system (CFS) from NOAA's National Centers for Environmental Prediction (NCEP) shown in Figure 2, deteriorates significantly beyond a few months. At a lead time of 6 months or more, the forecast skill is the much the same as using a long-term average (climatology).
Projecting hurricane activity over a longer time horizon typically requires the use of statistical models, like the linear inverse model used in Figure 3. These models are used to analyze historical SST anomalies to discern linear trends and cyclical patterns. While statistical models perform better than numerical models at lead times of 6 months or greater, statistical forecasts beyond one year have limited skill. The figure below shows forecast SST anomalies at different lead times (in red) compared to actual observed anomalies (in blue). The dotted lines show one standard deviation above and below the forecast, which represents approximately a 70% confidence interval. Note that even at short lead times, the confidence interval often straddles the long-term average, indicating the considerable uncertainty surrounding whether SSTs will be anomalously warm or anomalously cool.
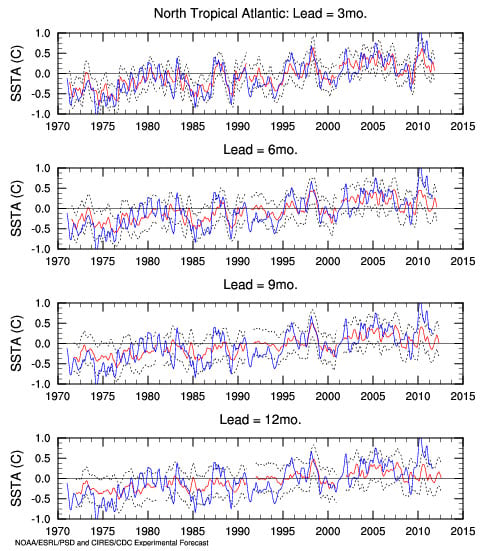
The current limitations in the ability to make reliable forecasts manifests clearly after 12 months; constructing a hurricane catalog based on a five-year point forecast of sea surface temperatures is associated with extremely high uncertainty.
Other Climatological Influences at Play
Apart from the difficulty in forecasting sea surface temperatures, a second complicating factor in developing a near- or medium-term model is translating elevated SSTs into hurricane risk. For one, even were it possible to forecast SSTs with absolute certainty, they would only explain part of the annual variability in tropical cyclone frequency. A statistical analysis of basinwide activity from 1950 to 2010 shows that Atlantic SST anomalies account for about one-quarter of the variability in storm frequency. There are many other factors that influence storm development, albeit to a lesser degree, and most of these are even less predictable than SSTs. Such climate factors include the El Niño Southern Oscillation (ENSO), which influences vertical wind shear over the Atlantic that can be destructive to storms, and the Saharan Air Layer, which when dust-laden can suppress activity.
Extending the analysis to hurricane landfalls, one finds an even smaller correlation. Examining data from the same period, Atlantic SST anomalies account for less than 1% of the variability in U.S. hurricane landfalls. Instead, mid-level steering currents, which are highly variable and unpredictable beyond a few days because they are determined by short-term weather patterns, are responsible for some 80% of the variation in storm tracks. Regardless of how many storms form in the basin, no damage will occur if these storms remain well offshore.
The 2010 season for example was an exceptionally active one, with 19 named storms including 12 that reached hurricane strength. However, no storm made landfall on the U.S. coastline at hurricane strength. The position of the Bermuda High (a large semi-permanent area of high pressure near the Azores) and a low pressure system situated over the U.S. East Coast for much of the core of the season deflected storms away from the U.S. Thus far, 2011 has seen 18 named storms—another very active season in the Atlantic—but only one U.S. landfall. On average, about 1 in 5 named storms makes landfall in the U.S. at hurricane strength.
Warm SSTs May Alter Patterns of Storm Genesis, Tracks, and Regional Landfall Risk
The primary focus of scientific investigation into climatological influences on tropical cyclones continues to be on basinwide activity. Yet careful analysis of the data indicates that it is not appropriate to simply scale up landfalls in proportion to the overall increase in basinwide activity and distribute them along the U.S. coast. Figure 4 shows the spatial distribution of storm genesis locations in years with warm and cool SSTs since 1950. It is immediately apparent that there are qualitative differences in regional risk in years with warm SSTs.
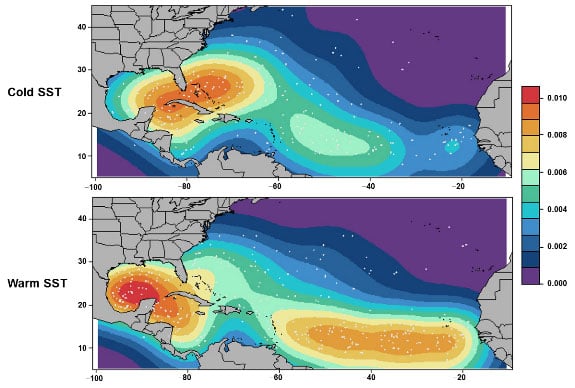
As Figure 4 shows, storm genesis in warm years increases in the Gulf of Mexico and shifts significantly eastward in the Atlantic. One implication is that elevated activity under warm SST conditions could actually result in a lower proportion of storms making landfall in the U.S. as compared to the long-term average proportion. First, storms that form in the Gulf pose a greater landfall threat because of their proximity to the U.S. coast, but there is little time for them to intensify before landfall. The Gulf Coast is therefore likely to experience more frequent landfalls at tropical storm strength, but little increase in hurricane landfalls.
Second, consistent with historical experience, storms that form in the eastern region of the tropical Atlantic and off the coast of Africa are more likely to curve northward before reaching the U.S. coastline. This is also the finding of newly published (2011) paper "Impact of the Atlantic Warm Pool on United States Landfalling Hurricanes" paper by Wang et. al, which attributes the shift in storm genesis location during warm years to an eastward expansion of the Atlantic warm pool. They conclude that in addition to increasing tropical cyclone activity in the basin, the eastward shift also increases the chance that tropical cyclones will turn northward without making landfall in the U.S., thus reducing the overall proportion of named storms making U.S. landfall as hurricanes.
AIR's Climate Conditioned Catalog Effectively Captures the Complex Interactions that Manifest Under Warm Ocean Conditions
As the above discussion has shown, there are significant limitations in our current abilities to forecast sea surface temperatures, and the relationship between SSTs and hurricane landfalls is far from simple. The fundamental question—and one that AIR's climate conditioned warm SST catalog is designed to address—is that of the influence on U.S. landfall risk. Only by carefully analyzing the historical record is it possible quantify the true impact of warm conditions on hurricane landfalls, and ultimately, on insured losses.
Instead of relying on forecasts of SSTs, AIR's approach—which has been applied consistently since 2007—is to condition the warm SST catalog on data from those years since 1900 with warmer than average SSTs, and directly assesses the impact on regional landfall metrics. Like the standard catalog, it represents a long-term and stable view of risk, and its methodology has been recently published in the peer-reviewed Journal of Applied Meteorology and Climatology.
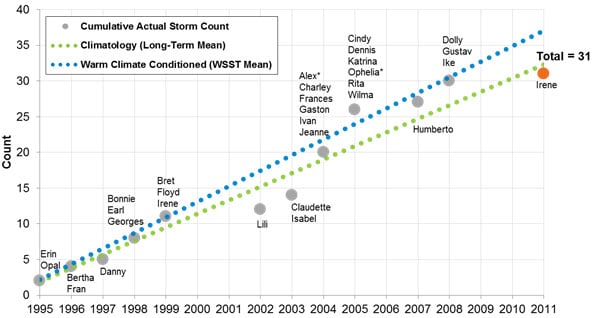
On average, the increase in the mean frequency of the conditioned catalog over AIR's standard catalog is approximately ten percent, although regional differences can be higher. Used together, the catalogs provide useful information about the sensitivity of insured losses to a warm ocean environment. This is illustrated in Figure 5, which shows the cumulative counts of actual U.S. loss-causing hurricanes since 1995 (the onset of the current period of anomalously warm SSTs), along with the cumulative mean frequency in AIR's standard catalog (green line) and the cumulative mean frequency conditioned on warm SSTs (blue line).
Research into climatological influences on U.S. hurricane landfall risk continues apace, and conflicting theories abound. Were each to be implemented in catastrophe models in the name of pursuing the latest science, the resulting instability in model output would be untenable. In the absence of a scientific consensus that would allow the underlying mechanisms to be modeled directly, AIR's approach implicitly, but effectively, captures the myriad complex interactions and shifting ocean and atmospheric patterns that manifest under warm ocean conditions.
