


Managing Typhoon Risk in South Korea
Dec 14, 2010
South Korea is at risk from a variety of natural disasters—including landslides, severe winter storms and even tsunamis—but typhoons and their accompanying floods stand apart; they are both the most damaging and the most frequent of the natural perils facing South Korea. In recent years, floods, particularly those that are typhoon-induced, have caused an estimated 80% of all property damage from natural disasters in South Korea—roughly 50 billion KRW annually.1
Meanwhile, insured losses from typhoons will only increase as properties continue to be built in areas of high hazard and insurance penetration rates continue to increase along with South Korea's rapidly growing economy. AIR's recently released typhoon model for South Korea stands poised to help companies better understand their typhoon risk and develop appropriate risk management strategies.
South Korea's Typhoon Climatology
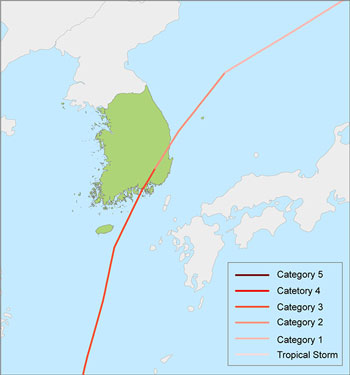
In an average year, South Korea experiences one landfalling typhoon, although at least one additional tropical cyclone comes sufficiently close to the coast to cause property damage. While typhoons in the country can bring both destructive winds and flood, very intense ones are relatively infrequent; the majority of landfalling typhoons in South Korea have been below Category 2 strength. However, even these can generate significant amounts of precipitation, and hence, flooding. Extratropical transitioning, mountainous terrain and prior landfalls elsewhere in the region all contribute to high precipitation.
Two typhoons that exemplify the severity of the precipitation and wind in South Korea's typhoon climatology are Rusa (2002) and Maemi (2003). In September 2002, the interaction between a southward-moving Rusa and an approaching frontal system resulted in significant precipitation across South Korea; amounts exceeded 800 millimeters.2 This heavy precipitation occurred up to several hundred kilometers from the typhoon landfall location. As Rusa tracked northeast along the frontal system, precipitation was further enhanced. Flooding damaged 45,000 homes and inundated 85,000 hectares—much of it in Kangnung, on the country's northeast coast.3
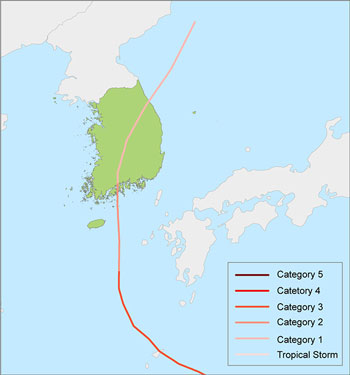
Typhoon Maemi formed in early September 2003 and made landfall at South Korea's southern tip on September 13, a strong Category 3 storm. The precipitation it produced was half of that from Rusa.4 However, Maemi's maximum gust—134 miles per hour recorded at Cheju Island—remains the national wind speed record for South Korea today. Maemi damaged 18,000 homes. Economic losses from the event were less than those from Rusa, but insured losses for Maemi, at 644 billion KRW (540.75mn USD),5 were three times that of Rusa because Maemi tracked through industrialized areas of Busan and its port facilities.

By: Dr. Peter Sousounis, Dr. Mary Louie, Dr. Cagdas Kafali, and Mr. Jason Butke
South Korea's Exposure at Risk
Much of South Korea was rebuilt in the aftermath of the Korean War, which ended in 1953. Today, modern buildings of 20-30 stories are common in major cities. These structures are typically made of reinforced concrete, which is quite resistant to flood and wind loads.
The rapid economic growth in the country means that at any given time, a portion of the buildings are under construction. Most of these will become mid- or high-rise buildings and their vulnerability varies by construction phase. Since the 1980s, building regulations in South Korea have greatly improved; modern high-rise commercial structures—including those under construction—are built to strict building codes. Modern apartment buildings follow suit.
While typhoons can impact most anywhere in South Korea, some locations are more at risk. These include the country's south and south east, which are home to numerous important industrial facilities, including ports, factories, oil refineries and chemical manufacturers. Many of these operations have been severely interrupted during strong typhoons. Located in southeast Korea, Busan, the country's second largest city and its largest port, experienced significant damage from 1959's Typhoon Sarah, and again from Maemi four decades later.
Compared to cities like Busan, the densely populated capital of Seoul is relatively protected from typhoons; still, storms sometimes make their way there. A recent example is this year's Typhoon Kompasu which, with weak Category 1 winds, caused only minimal damage in the capital due to the resilience of the building stock there. To the west of Seoul, however, in the seaport city of Incheon, damage from Kompasu's high winds was considerable.
Preparedness: Flood and Wind Mitigation
South Korea's rivers tend to be short and steep. During heavy precipitation, they can quickly peak and overflow. This makes controlling the river flow during very wet typhoons challenging. Efforts to address such challenges have been most significant only since the mid-1960's when the government began focusing on the construction of dams. A project to improve dams along the country's four major rivers—the Han, Nakdong, Gum, and Youngsan—resulted in a 40% reduction of flood damage by 1980.
In the 1980s and 1990s, the government identified more than 500 sites as being highly vulnerable to typhoon winds and floods, and between 1998 and 2004 invested more than 1 billion USD in mitigating the risk at these locations.6 Since 1990, storms like Typhoons Gladys (1991) and Rusa have caused South Korea to accelerate its flood defense measures. The Office of the Prime Minister set up a task force for planning comprehensive flood mitigation strategies following Typhoon Rusa; between 2003 and 2011, the task force planned to allocate over 40 billion KRW (roughly 35 million USD in 2010 dollars) across 76 different projects from flood forecasting to retrofitting aged facilities and it also established additional funds for post-disaster recovery systems.
Today, examples of flood-mitigation techniques in use include increasing sewer capacity, creating rainwater storage by using underground tanks, utilizing flood forecasting and flood-analysis models to determine when and where the risk of flooding is highest, and controlling water flow with levees, dams, stream gates, and pumping facilities. The effectiveness of flood defense systems varies across the country, with the better mechanisms in the larger urban areas, such as Seoul and Busan.
Although much of the focus has been on flood mitigation, the Korean Building Law (KBL), established by the Ministry of Construction and Transportation (MCT), ensures that structures are built to withstand wind damage from typhoons. In 1996, because of significant economic growth throughout South Korea, the MCT requested that the Architectural Institute of Korea (AIK) revise the component of the law pertaining to lateral wind loads. Since May 2000, the AIK load standard has been used for the structural design of buildings; it is also a part of the Korean National Building Code.
A Young Insurance Market
South Korea's non-life insurance market is still maturing, with penetration at only about 2.37% of GDP.7 As a result, insured losses from typhoon winds and flood have typically been low—limited to 2-3% of total economic losses. The exception was Typhoon Maemi, which tracked through the cities of Pusan and Ulsan—two highly industrialized centers—and caused insured losses of KRW 644.36 billion (USD 540.75 million), amounting to 12% of total economic losses in 2003.8
Prior to Maemi—and Rusa, too—South Korea was not recognized for its exposure to large insurance losses. Today, however, that is changing. The country's non-life direct insurance market now includes ten domestic companies. Reinsurance, meanwhile, is dominated by Korean Re, although at least five other global reinsurers also write business in Seoul. Because companies typically decline to write insurance for residential properties exposed to the windstorm and flood perils, catastrophe insurance in the country currently pertains mainly to commercial accounts. Take-up rates for commercial properties are roughly 40%.
South Korea's Risk from a Regional Perspective
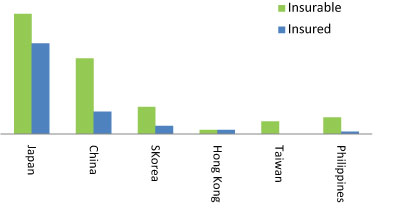
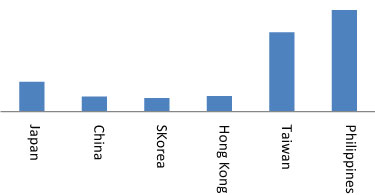
Exposure in countries in the Northwest Pacific basin varies significantly, as do insurance take-up rates. Japan and China have significant property accumulation, followed by South Korea, the Philippines, Taiwan and Hong Kong. Meanwhile, insurance market penetration for the typhoon peril is highest in Hong Kong and Japan. These differences mean that the impact of typhoons on the insurance industry varies considerably, too. Figure 3 compares total insurable and insured exposures for each country.
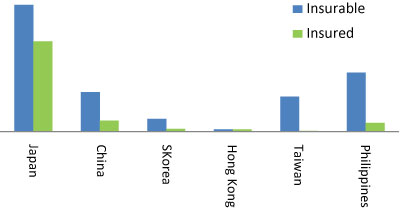
AIR estimates of insurable and insured average annual aggregate losses (AAL) from typhoon winds and flood are shown in Figure 4. The aggregate AAL is highest in Japan—a result of high levels of exposure, high market penetration for typhoon insurance, and the fact that a large part of Japan is exposed to the typhoon hazard. For China, although insurable exposure is comparable to Japan, low levels of insurance market penetration and the fact that typhoons mainly impact only the southern coastal provinces as opposed to the country as a whole mean lower risk. For South Korea, the insured AAL is lower still due to lower risk.
It should be noted, however, that although insured risk is relatively low in countries like South Korea, Taiwan and the Philippines today, if all insurable exposure were to carry typhoon insurance, the loss potential would be significantly higher.
Yet another way of illustrating the impact of typhoon activity in the region is loss cost, or loss per unit of exposure, which Figure 5 illustrates. Due to high levels of typhoon activity in the southern part of the basin, as well as significant exposed exposure, the loss cost in the Philippines and Taiwan is the largest. In Japan, the loss cost, while lower, is relatively high, which can be explained by the unique shape and orientation of this island country, which makes most of the exposure there susceptible to any given typhoon. Finally, the loss cost for South Korea—where large portions of the country are not affected by typhoons—is similar to that of China and Hong Kong. However, southern provinces of China, especially, Guangdong, Fujian and Zhejiang, and southeastern regions in South Korea, are very typhoon-prone, and loss costs are much higher in those regions.
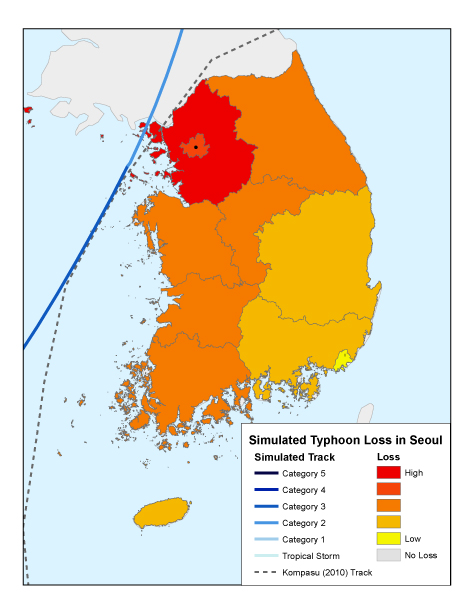
Large Loss Scenario in Seoul
One of the benefits of catastrophe modeling is the ability to examine—and plan for—large loss scenarios. Seoul is South Korea's largest city (population 12 million). Though it is more likely to be impacted by storms that have already made landfall to the south or west, and weakened, strong events are nevertheless possible.
If a relatively large typhoon struck Seoul today, the total property value at risk would be enormous. To assess the potential insurance impact, AIR simulated a similar, but more intense version of Typhoon Kompasu striking the capital (with central pressure of 967 mb compared to Kompasu's 980 mb). The simulated event produces a 1% exceedance probability (100-year return period) loss.
AIR estimates that this event, which follows Kompasu's track and makes landfall to the west of Seoul (and thus its strongest winds impact the capital) would bring sustained winds of near 90 miles per hour to Incheon and 80 miles per hour over Seoul, resulting in insured losses of just over 1 billion USD. By comparison, AIR estimates that insured losses from Kompasu, which brought winds near 60 mph to Incheon (over land) and roughly 50 mph winds in Seoul, should not exceed 200 million USD.
It is also important to note that Kompasu was a relatively "dry" typhoon; a more intense storm bringing heavier precipitation would have caused substantial additional loss from precipitation-induced flooding. Like Kompasu, our simulated scenario above is also a relatively dry typhoon. Thus, flood losses were minimal.
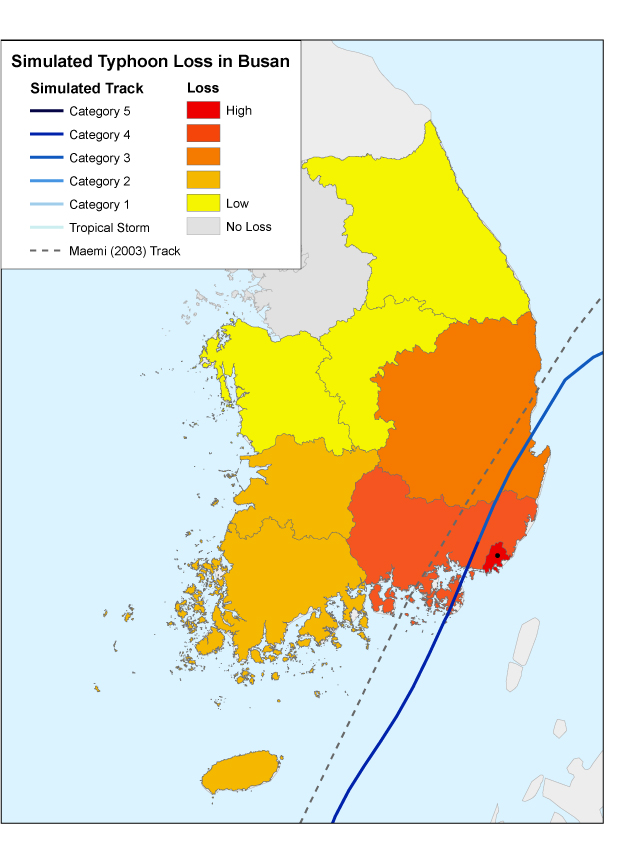
Large Loss Scenario in Busan
AIR also assessed the financial impact of a similar, but more intense version of 2003's Typhoon Maemi (a Category 3 by central pressure) striking Busan. For the analysis, AIR simulated a typhoon with a landfall central pressure of 944 mb (compared to Maemi's 954 mb), bringing sustained winds of over 100 mph to Busan. This event produces a 0.67% exceedance probability (150-year return period) insured loss of about 1.2 billion USD—roughly double that from the historical Maemi (0.55 billion USD in insured loss).9 In addition to a 10 millibar decrease in central pressure (increase in intensity), the simulated event moves nearly 5 mph slower than Maemi, lingering over Busan. Coupled with a landfall that was closer to Busan's city center, the resulting modeled losses from this storm far exceed those from Maemi.
Closing Thoughts
South Korea was recently added to AIR's Northwest Pacific basinwide typhoon model. Features of the model include a windfield based on data analyzed at AIR as well as published research, and a third-generation precipitation module developed at AIR—one that uses soil information, land use/land cover, and terrain height to reroute precipitation and identify areas at high risk from flood. Flood mitigation is explicitly accounted for in the model, as are regional differences in wind vulnerability.
In the past several decades, South Korea has experienced rapid growth. And in recent years, large typhoons have wrought significant property damage, particularly from flood, bringing some Korean insurance companies to the brink of exhausting their catastrophe coverage. Although South Korea has made significant strides in disaster mitigation and preparedness, continued efforts in this area are necessary, as is a reevaluation by the industry of the risk the country faces from typhoons. AIR's newly released typhoon model for South Korea can help companies manage their risk, even as the country's insurance market continues to mature.
1 Kim, S., Y. Tachikawa, and K. Takara. 2007: "Recent Flood Disasters and Progress of Disaster Management System in South Korea." Ann. Disast. Prev. Res. Inst. 50B: 1-17.
2 Ibid.
3 Ye, 2004. Typhoon Rusa and Super Typhoon Maemi in Korea. The University Corporation for Atmospheric Research.
4 Kim, op. cit.
5 AXCO, 2010. "Insurance Market Report," Republic of Korea: Non-Life (P&C), AXCO Insurance Information Services, London, UK.
6 Park, D, 2005. "Republic of Korea: National Reporting and Information on Disaster Reduction." World Conference on Disaster Reduction.
7 AXCO, op. cit.
8 Ibid.
9 Trended to current dollars.
