As Hurricane Matthew approached the Florida coastline in October 2016, it brought back memories of the 2004 hurricane season that clobbered Florida both in terms of damage and the unexpected spike in repair costs that followed. The 2004 season was an unusual confluence of events during which three moderately damaging storms (Charley, Frances, and Jeanne) occurred in relatively quick succession, impacting a roughly similar area and causing much more damage collectively than would be expected from them individually.
At the time, Florida was also the center of what has been described as a hyperactive construction market driven by house price speculation and the approaching retirement of the first baby boomers. The result was a booming local construction market overwhelmed by the onslaught of multiple hurricanes in quick succession and little ability to adjust to the increased demand for workers.
While construction materials were available in other Florida markets and could also be trucked in from out of state, the local supply of workers could not easily expand. Because displaced homeowners were competing for temporary housing, there was little accommodation available for workers who might have been brought in from other regions.
Supply and demand before the onslaught
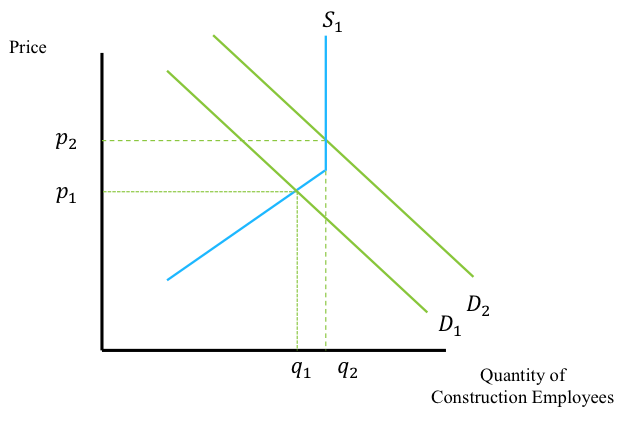
Harking back to your Economics 101 class, Figure 1 illustrates the supply and demand for the local construction labor market prior to the 2004 hurricane season. The local market at the start of the construction season includes all the workers available for the contracted work and the market is assumed to be at full employment. Price (P1) and quantity (Q1) identify the equilibrium in this chart (before the 2004 Hurricane Season). The supply of construction labor is assumed to be constrained in the short and medium terms, as represented by the kink in the supply curve (S1). The vertical portion of the labor supply curve represents the obstacles to bringing additional workers into the local market.

How things changed as a result
After the 2004 hurricane season, the demand curve shifted to the right (D2) in response to the increased demand for construction labor, as shown in Figure 2. Because the local construction market was at full employment and the labor supply was constrained, labor costs temporarily increased in response to the need for reconstruction after Charley, Francis, and Jeanne (P2). Here, the equilibrium immediately after the 2004 season is is seen at the intersection of P2 and Q2. After such a spike in repair costs like this, either the supply will adjust over time to a higher-priced demand surge equilibrium (P2, Q2), or the demand for construction labor will shift back to previous levels (D1) and the price of labor will readjust accordingly (P1).

The demand for labor after a hurricane is directly related to the severity of damage in the local market. It takes a surprising amount of damage to use up the normal slack in the local labor market and drive the cost of labor into a condition of demand surge or unexpected increases. Even if the worst of a major demand surge-inducing catastrophe is limited to one local market, damage in other nearby markets can use up any excess capacity that may exist within a reasonable travel distance, driving up the local costs even higher.
But what about 2016?
Every hurricane season is unique in time and place. Could the hurricane events of 2004 have the same impact today? There are a couple of mitigating factors:
- The housing market has cooled off and labor costs have been steady, if not declining
- The level of construction code enforcement in the past 12 years would determine if Charley, Frances, and Jeanne could cause the same level of damage
In the end, the question everyone is asking is, “did Hurricane Matthew result in a surge in demand and thus higher repair costs?”
The storm’s track was unusual and unexpected, and while it was an intense hurricane, the center and the strongest winds remained offshore. Matthew had weakened to minimal Category 1 strength by the time it made landfall 40 miles northeast of Charleston, South Carolina, on October 8. Damage from the storm was widespread along the eastern coast of Florida and the coasts of Georgia and South Carolina, but there was no one area where the damage was particularly severe. Matthew was by far the most destructive U.S. hurricane of the year; at this point, it is unlikely that we will see significant demand surge from the 2016 hurricane season—unless something unexpected happens in these closing days.


