On Monday, September 25, AIR released modeled loss estimates for Hurricane Maria’s path through the Caribbean. The trail of destruction began on September 18 with a landfall on the island of Dominica as a Category 5 storm and effectively ended as Maria pulled away from the Turks and Caicos Islands on Friday, September 22.
While several islands were impacted—some severely—the focus of attention has been on Puerto Rico, and it is fair to say that our loss estimates for the U.S. territory have been surprising to many. "How can an island in the Caribbean possibly generate more than a few billions of dollars of insured loss?," we have been asked. The answer lies in the combination of factors that make up what is undoubtedly an extreme event: Maria's damaging winds, which affected virtually the entire island; the total value of insured property in harm's way; and the vulnerability of that property to Maria's Category 4 wind speeds. We go through each of these below.
It is worth noting at the outset, however, that roughly 60% of the AIR modeled losses are generated by the industrial line of business. Unlike many other islands in the Caribbean, whose economies rely heavily on tourism, the economy of Puerto Rico is largely driven by manufacturing—primarily by pharmaceuticals, petrochemicals, electronics, and textiles within that sector. (It is estimated, for example, that there are more than 80 pharmaceutical manufacturing plants in the territory.)
Maria's Intensity
Hurricane Maria was all but the perfect storm for Puerto Rico. If it fell short of that descriptor, it was because its strong Category 4 wind speeds could have been even higher. Just two hours before landfall in Puerto Rico, Maria’s sustained winds were 160 mph; five hours before that, they were at 175 mph. Maria was the strongest storm to hit Puerto Rico in 85 years.
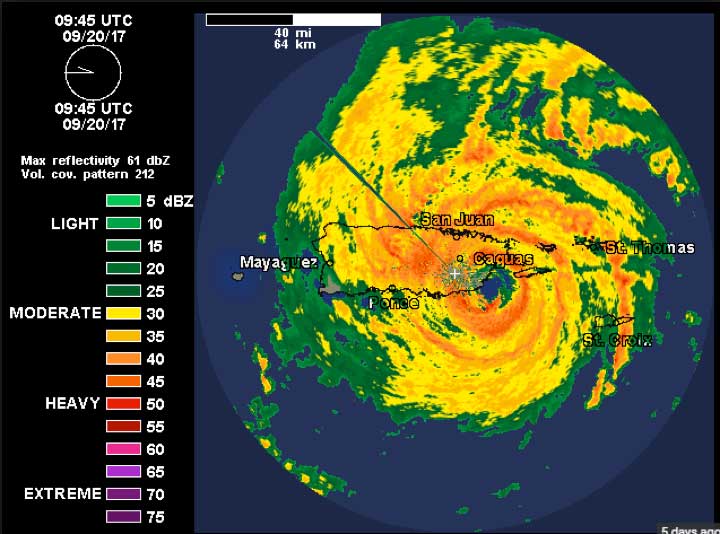
The National Weather Service NEXRAD radar image in Figure 1 was the last view of Maria before the radar was destroyed. The image depicts precipitation and the orange and red ring around they eye is the eyewall, which is the location of the very strongest winds. The eye’s diameter at landfall was around 35 miles. The north-to-south distance across Puerto Rico is also around 35 miles, and because the storm traversed the island in a general east-to-west direction, virtually the entire island was impacted by Maria’s strong winds.

Puerto Rico’s Insured Exposure
The robustness of AIR’s modeled loss estimates relies on the robustness of the industry exposure database (IED) used to generate them. Prior to releasing the estimates, AIR took considerable care to validate our view of industry exposure on Puerto Rico and confirmed that our overall aggregates of total insured value, or TIV, are consistent with information from several industry sources that included reinsurers.
Table 1 shows the replacement value of insured properties in Puerto Rico as of the end of 2014.
LOB | Total | Building | Contents | Time Element |
Residential | 71.32 | 68% | 22% | 10% |
Commercial | 67.79 | 67% | 19% | 14% |
Industrial | 123.60 | 45% | 45% | 10% |
Auto | 19.24 | - | - | - |
TOTAL | 281.95 |
|
|
|
Note that the industrial sector accounts for the lion’s share of the exposure. Note, too, that industrial risks, far from being concentrated in the suburbs of San Juan, are distributed throughout the island, nearly every corner of which experienced strong, damaging winds.
Contribution to Modeled Losses by Line of Business
Table 2 shows the percentage contribution by lines of business to the total insured event-level gross loss in Puerto Rico. The ranges correspond to the range in the total loss estimates represented by the five scenarios posted on the ALERTTM website. The percentage contributions by coverage for each of the aforementioned lines of business are also shown.
Line of Business | Contribution to total event-level loss |
Single-family homes | 13% - 16% |
Apartments | 3% - 4% |
Hotels and Guest Houses | 2% - 3% |
Commercial | 12% - 13% |
Industrial | 62% - 67% |
Auto | 1% - 2% |
The significant contribution to total losses from the industrial line of business is quickly apparent. However, it is important to point out that within the industrial line of business, the vulnerability of assets varies significantly—from highly vulnerable light metal construction for small manufacturers all the way to well-built facilities in the pharmaceutical industry. Because the loss estimates are highly sensitive to these differences, it is important that clients take particular care in how they are coded in Touchstone®.
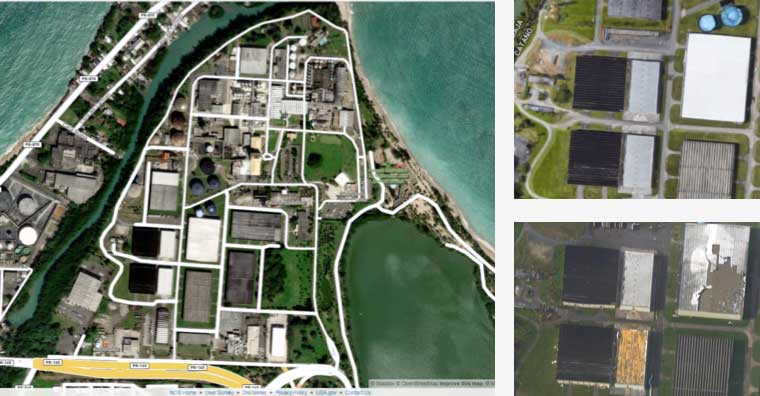
Before issuing our loss estimates for Maria, AIR engineers examined imagery coming out of Puerto Rico of damage to commercial and industrial buildings. The figure below shows one example. However, it is important to emphasize that there is significant uncertainty in the actual damage of these various types of risks, and modeling them remains a challenge with the available information.

Modeled Losses for Puerto Rico
AIR has estimated that total insured losses for Puerto Rico from Hurricane Maria will fall between USD 35 billion and USD 75 billion. That range corresponds to a range of exceedance probabilities between 0.4% (a 250-year loss) and 0.10% (a 1,000-year loss). An extreme event, certainly, but larger losses are possible.
It is clear that Hurricane Maria has dealt a devastating blow to Puerto Rico (and several other islands in the Caribbean), which was already having its share of economic challenges in recent years. From a meteorological and impacts point of view, Maria is truly an extreme event for the island, as borne out in the range of return periods (250-year to 1,000-year) corresponding to AIR’s range of insured loss estimates for Puerto Rico.
Sources of Uncertainty
While the scale of economic devastation is immense by all accounts, there are also sources of uncertainty that could impact the final insurance industry loss for Hurricane Maria. As always, there is uncertainty in the actual meteorological parameters of the storm. Recording instruments on the ground in Puerto Rico, for example, were knocked almost immediately after landfall. The National Hurricane Center’s “best track” report will not be available for months. However, the focus of the bulleted list below is largely on factors affecting the insurance payouts.
- The widespread nature of the damage and the likely extended reconstruction process could cause shortages of labor and materials. The resulting demand surge—increases in the price of labor and materials—could be significant. On the other hand, there are several reasons to think that demand surge could be negligible, including already high unemployment that could mitigate increases in labor costs. Reconstruction could well be delayed due to extended power outages or to lengthy litigation over what will be covered. In addition, the Governor of Puerto Rico has stated that he expects some migration of residents from the U.S. territory to the mainland. Demand surge is included in AIR’s loss estimates and its impact is considerable, increasing the losses in Puerto Rico by more than 25% at the high end of the loss range and by about 16% at the low end.
- Dwellings in Puerto Rico have suffered wind damage to the most vulnerable components of the properties, often the upper story, which is usually of timber construction. While the more solidly built ground floors have less structural damage, we expect damage to contents due to water infiltration and flooding. How dwelling policies will pay for such damage is a source of uncertainty, since in many policies, flood is not a covered peril. Also, in some dwellings, the more vulnerable, upper part of the property may not be covered for physical damage.
- As has been widely reported, it may be weeks, if not months, before power is restored and therefore business interruption losses can be severe. Certain sectors, like hotels, are likely to suffer business income loss.
- Disruptions to Puerto Rico’s pharmaceutical facilities have been widely reported and are, in fact, expected in light of the impacts on employees, physical damage to the facilities, power interruption, and lack of refrigeration and proper storage. There is uncertainty, however, around the robustness of business continuity planning. If plants were well prepared with excess inventory (or evacuation of inventory before the storm) or the ability to spin off production to other plants, either in Puerto Rico or elsewhere, business interruption losses may be mitigated. What losses do occur are likely to result in complex claims to settle and it might be some time before the true impacts are known.
- Reports indicate severe and widespread damage to the transportation system and overall infrastructure. Coastal areas have seen extensive damage to roads and bridges, which can further hinder recovery and reconstruction. The slow and extended restoration can lead to higher levels of damage to insured properties as building envelopes remain open to the elements.
- With an already struggling economy that has now experienced this crippling blow, there may be political pressure on insurers to be generous in how they settle claims.
There is much more to learn about this storm and its impact in Puerto Rico and throughout the Caribbean. Ground-truthing the loss estimates will take time, as access will likely be severely restricted for weeks. While Maria clearly has had tragic consequences for the people of Puerto Rico, the storm will also provide invaluable information for understanding the vulnerability of the building inventory and how the insurance industry will respond.
AIR clients wishing for more detail around what was discussed in this blog can download the white paper “Hurricane Maria: Understanding the AIR Loss Estimates" from AIR's website (client login required).
