I was recently asked what I thought about the impact of Hurricane Irma on loss adjustment expenses (LAE). I have spent a lot of time looking at post-catastrophe loss inflation in the past few years. Most of that time was focused on demand surge because, as an economic phenomenon, it transcends insurance losses and there is a good deal of data that can be used to quantify and describe it. Loss adjustment inflation only affects insured property, but is a little more difficult to quantify because of the lack of detailed data.
Post-loss inflation in loss adjustment is primarily caused by a shortage of labor. The chart I posted last November to describe construction demand surge also applies to loss adjustment. There are two main classifications of loss adjusters: staff adjusters and independent adjusters. Because of the nature of the work of loss adjusting, this mix of adjuster classifications makes it easier to increase the supply of loss adjusters in the short or medium term. Loss adjusting is somewhat specialized and because of the skills required, it is not something you can substitute other labor for easily. Unlike demand surge, loss adjustment inflation tends to last for about one quarter, but it can be longer if there are circumstances that keep adjusters from starting right away. Staff adjusters work for insurance companies and are usually on salary, whereas independent adjusters work only when there is a disaster but can make a lot more that staff adjusters.
Adjuster’s Income Data
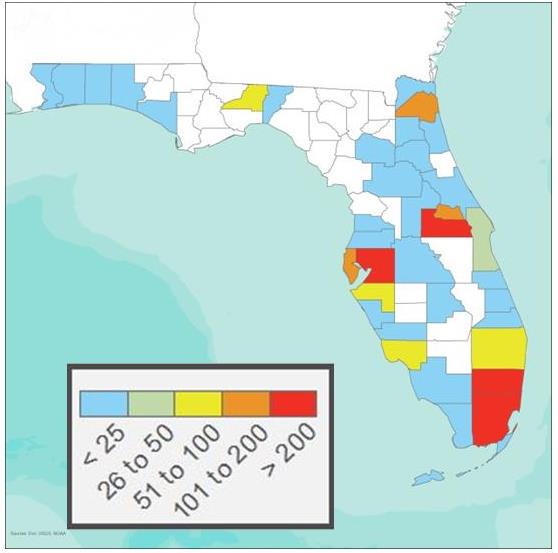
In the U.S., it is fairly straightforward to get data on loss adjusters and the income they make. I always start with the Quarterly Census of Employment and Wages (QCEW). Because the data is reported by county, it allows us to look at how loss adjustment workers and salaries changed quarterly after an extreme event strikes a particular county. The map in Figure 1 represents the spatial distribution of the employed loss adjusters in Florida during the third quarter of 2004. It illustrates some of the limitations of using the data. Not all of the counties had loss adjusters, for example. One reason is that in counties where there are few workers, data is suppressed to protect personally identifiable information (PII); another is the nature of the work. The QCEW reports where the workers are employed not where the actual work is done. In the case of loss adjusters, work is always performed in the field and requires travel. Any model developed using this data will therefore require spatial smoothing.
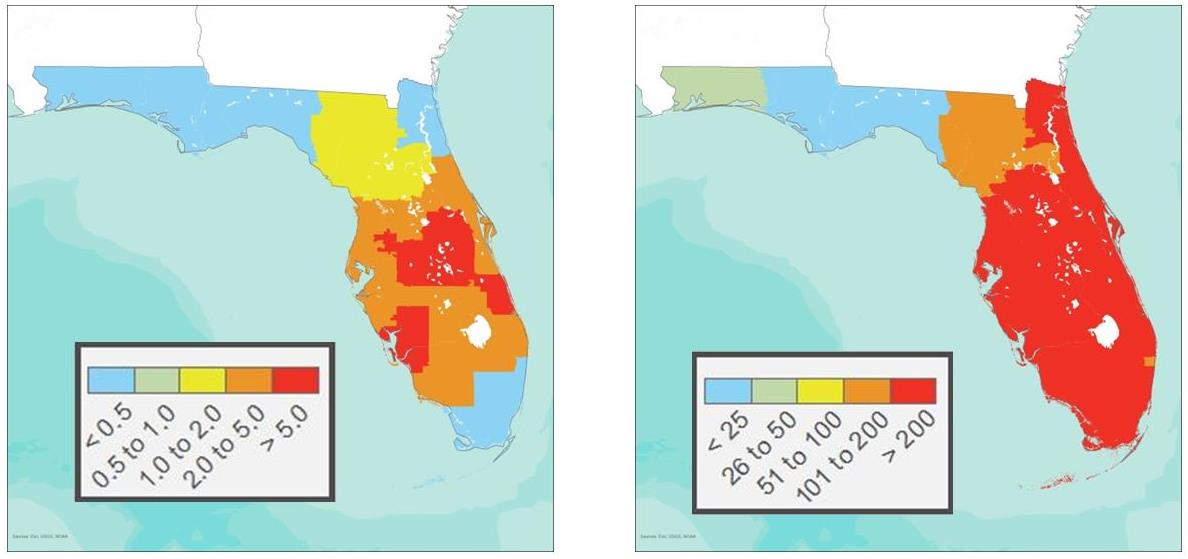
To get an idea of the potential increase in LAE, it always helps to look back at significant events in the same area. In 2004, Florida was hit with a series of hurricanes—Charley, Frances, and Jeanne (CFJ)—that came in such rapid succession that it helps to lump them together to understand how they impacted LAE. Two good ways to look at the impact on loss adjuster employment are local damage density and expected claims per loss adjuster using employment prior to the event. The first we have looked at before in demand surge presentations at AIR’s Envision conference; the second can be problematic because data on employment, as we saw in Figure 1, may be too sparse to directly correlate with the damage. In the maps in Figure 2, the damage density for the composite damage of CFJ is shown on the left. You can easily see that there is a consistent damage path from the southwest of Florida to the northeast. The map on the right shows the one quarter change in loss adjuster wages by county spatially smoothed from the time of the event.
While we cannot distinguish between staff adjusters and independent adjusters, we can still get some insights by looking at the changes in employment and wages over time in the state of Florida. In the chart in Figure 3 you can see the quarterly changes in average payroll and employment from the beginning of 2004 to the end of 2005. Looking at payroll first, we can see that, as expected, unit wages go up more than 80% in the fourth quarter of 2004. In the following quarter we see the classic response to an increase in wages—loss adjuster employment goes up, in this case by 30%.
This could be an indicator that there was a lot of loss adjuster unemployment in Florida, but it is more likely that independent adjusters from outside the area were being attracted by higher wages and were finding employment through local firms. In response to the increased employment, average wages decreased more than 30% that same quarter. It is also interesting to note that employment decreased by the second quarter of 2005, suggesting that the bulk of claims adjusting had been completed and it was time to move on.
What Does This Mean for Hurricane Irma?
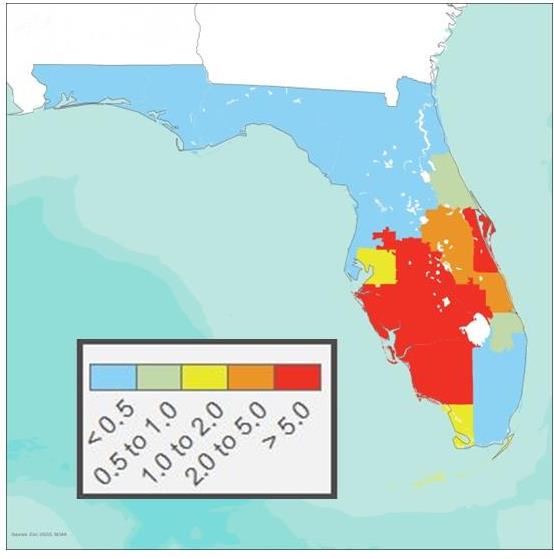
Taking a cue from the past, we need to look at damage intensity and the number of loss adjusters already local to the affected area. The damage distribution from CFJ looks very similar to one of the likely damage scenarios for Hurricane Irma, so I decided to look at this scenario as an example. The map in Figure 4 shows a possible wind and storm surge damage density from hurricane Irma. You can see that the damage is widespread and that many of the same areas impacted by CFJ are affected.
Loss adjustment employment in the past few years looks very different from the 2004 and 2005 hurricane seasons. In Figure 5 you can see the quarterly time series of employment from 2004 to 2016. Because of QCEW data publishing lags, the 2017 data will not be fully available until July 2018, so we will have to focus on 2016. The first things that stand out are the two employment spikes in 2004 and 2005 that coincide with the end of the hurricane seasons. Both spikes show loss adjuster employment peaking at more than 5,000 followed by a decline. Employment has been steadily increasing since, with a leveling off in 2013 at around 5,000 employees in the state. This is possibly the strongest indicator that there may not be a large spike in average wages post-Irma followed by a jump in employment.
How do we interpret this data? During the 2004 hurricane season the total LAE costs are going up, average wages are temporarily increasing, and in some case there appears to be movement from one county to the next. Is there cost inflation? It appears there are two effects: the direct effect we saw when average wages increased in Q4 2004 followed by an influx of employment the following quarter and a decrease in wages.
Logically, we know there is going to be an increase in independent adjusters relative to staff adjusters for extreme events, but this effect will vary between insurers based on their unique requirements. The substitution effect alone is going to increase loss adjustment expenses, but the move toward independent adjusters may not have a straightforward effect on expenses, depending on the contract agreement.
The steady increase in loss adjusters in Florida over time suggests that the first effect may be less important and that to understand cost increases it may be more important to focus on the use of independent adjusters. In the future, use of drone technology and flyovers of affected areas may be the best ways to manage these costs, but for now we can probably expect significant increases in wages in areas that are the worst affected.
Only time will tell how this scenario will play out, so we will have to wait for the 2017 QCEW data to come out next year to look back and see how the 2004 and 2017 seasons compare.